sprint --> FTP
A full ML data science pipeline predicting 20-min Functional Threshold Power (FTP) for competitive cyclists based on 30-second sprint efforts.
00

problem
Measuring FTP directly requires a demanding 20-minute all-out cycling effort: one that is physically exhausting, psychologically challenging, requires accurate self-pacing, and demands access to a calibrated power meter and a safe testing environment.
solution
If a 30-second maximal sprint — a far simpler, faster, and less physically taxing effort — could reliably predict FTP, it would meaningfully lower the barrier to aerobic fitness assessment. A sprint takes under a minute, doesn't require careful pacing, can be performed on a trainer or an empty road, and provides additional information (peak neuromuscular power, anaerobic capacity) as a byproduct.
TLDR: Cyclists measure fitness using something called Functional Threshold Power (FTP) — basically the highest power output you can sustain for 20 minutes. The problem is that testing it sucks: it's a grueling, pacing-dependent, all-out effort. This project asked whether a quick 30-second sprint could predict that number instead. Using machine learning on data from ~4,800 cyclists, the answer is: kind of — a sprint gets you in the ballpark (~33 watts off, on average). But the real finding is that extending the effort to just 2 minutes dramatically improves the prediction, because that's right where the body shifts from burning short-burst energy to relying on the aerobic engine that actually drives FTP. A 2-minute test isn't a replacement for the real thing, but it's a realistic screening tool for coaches who need quick assessments across a lot of athletes.
Can a 30-Second Sprint Predict Your FTP?
A machine learning study of 4,768 cyclists · Ultrathon.io
About the Dataset
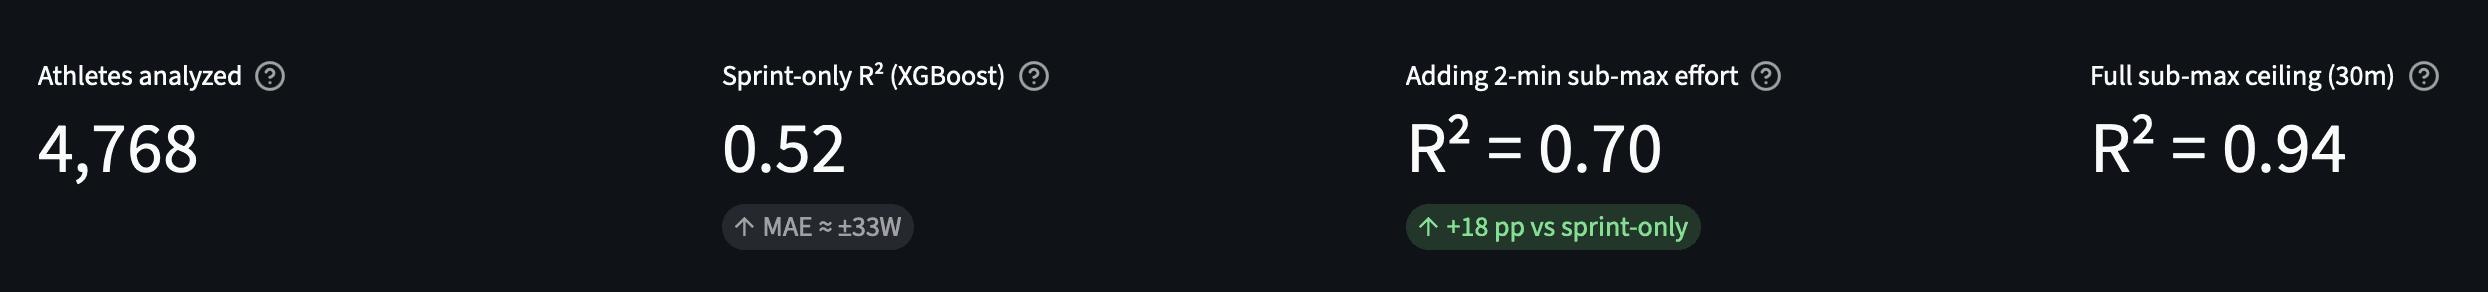
This project uses the GoldenCheetah OpenData dataset (Kaggle: markliversedge/goldencheetah-opendata), a large anonymized collection of cycling training files contributed by athletes who use GoldenCheetah — an open-source cycling analytics platform used worldwide. From each athlete's training history, GoldenCheetah computes a Mean Maximal Power (MMP) curve: the highest average power ever recorded for every duration from 1 second to 60 minutes. After removing physiologically implausible records (corrupted age values, power readings outside credible ranges for cycling, and missing biometrics), the dataset retains 4,768 clean athletes from an original 6,043 (79% retention). The cohort is 97% male, ages 14–88, and spans the full spectrum from recreational cyclists to competitive amateur racers.
The prediction target is 20m_critical_power: the athlete's all-time best average power over a 20-minute effort. This is the standard field proxy for Functional Threshold Power (FTP) — the gold-standard metric of aerobic cycling performance, used to set training zones, evaluate fitness, and guide race pacing strategy. FTP values in this dataset range from 57W to 587W, with a mean of 273W (std = 68W), reflecting the wide ability range across the dataset.
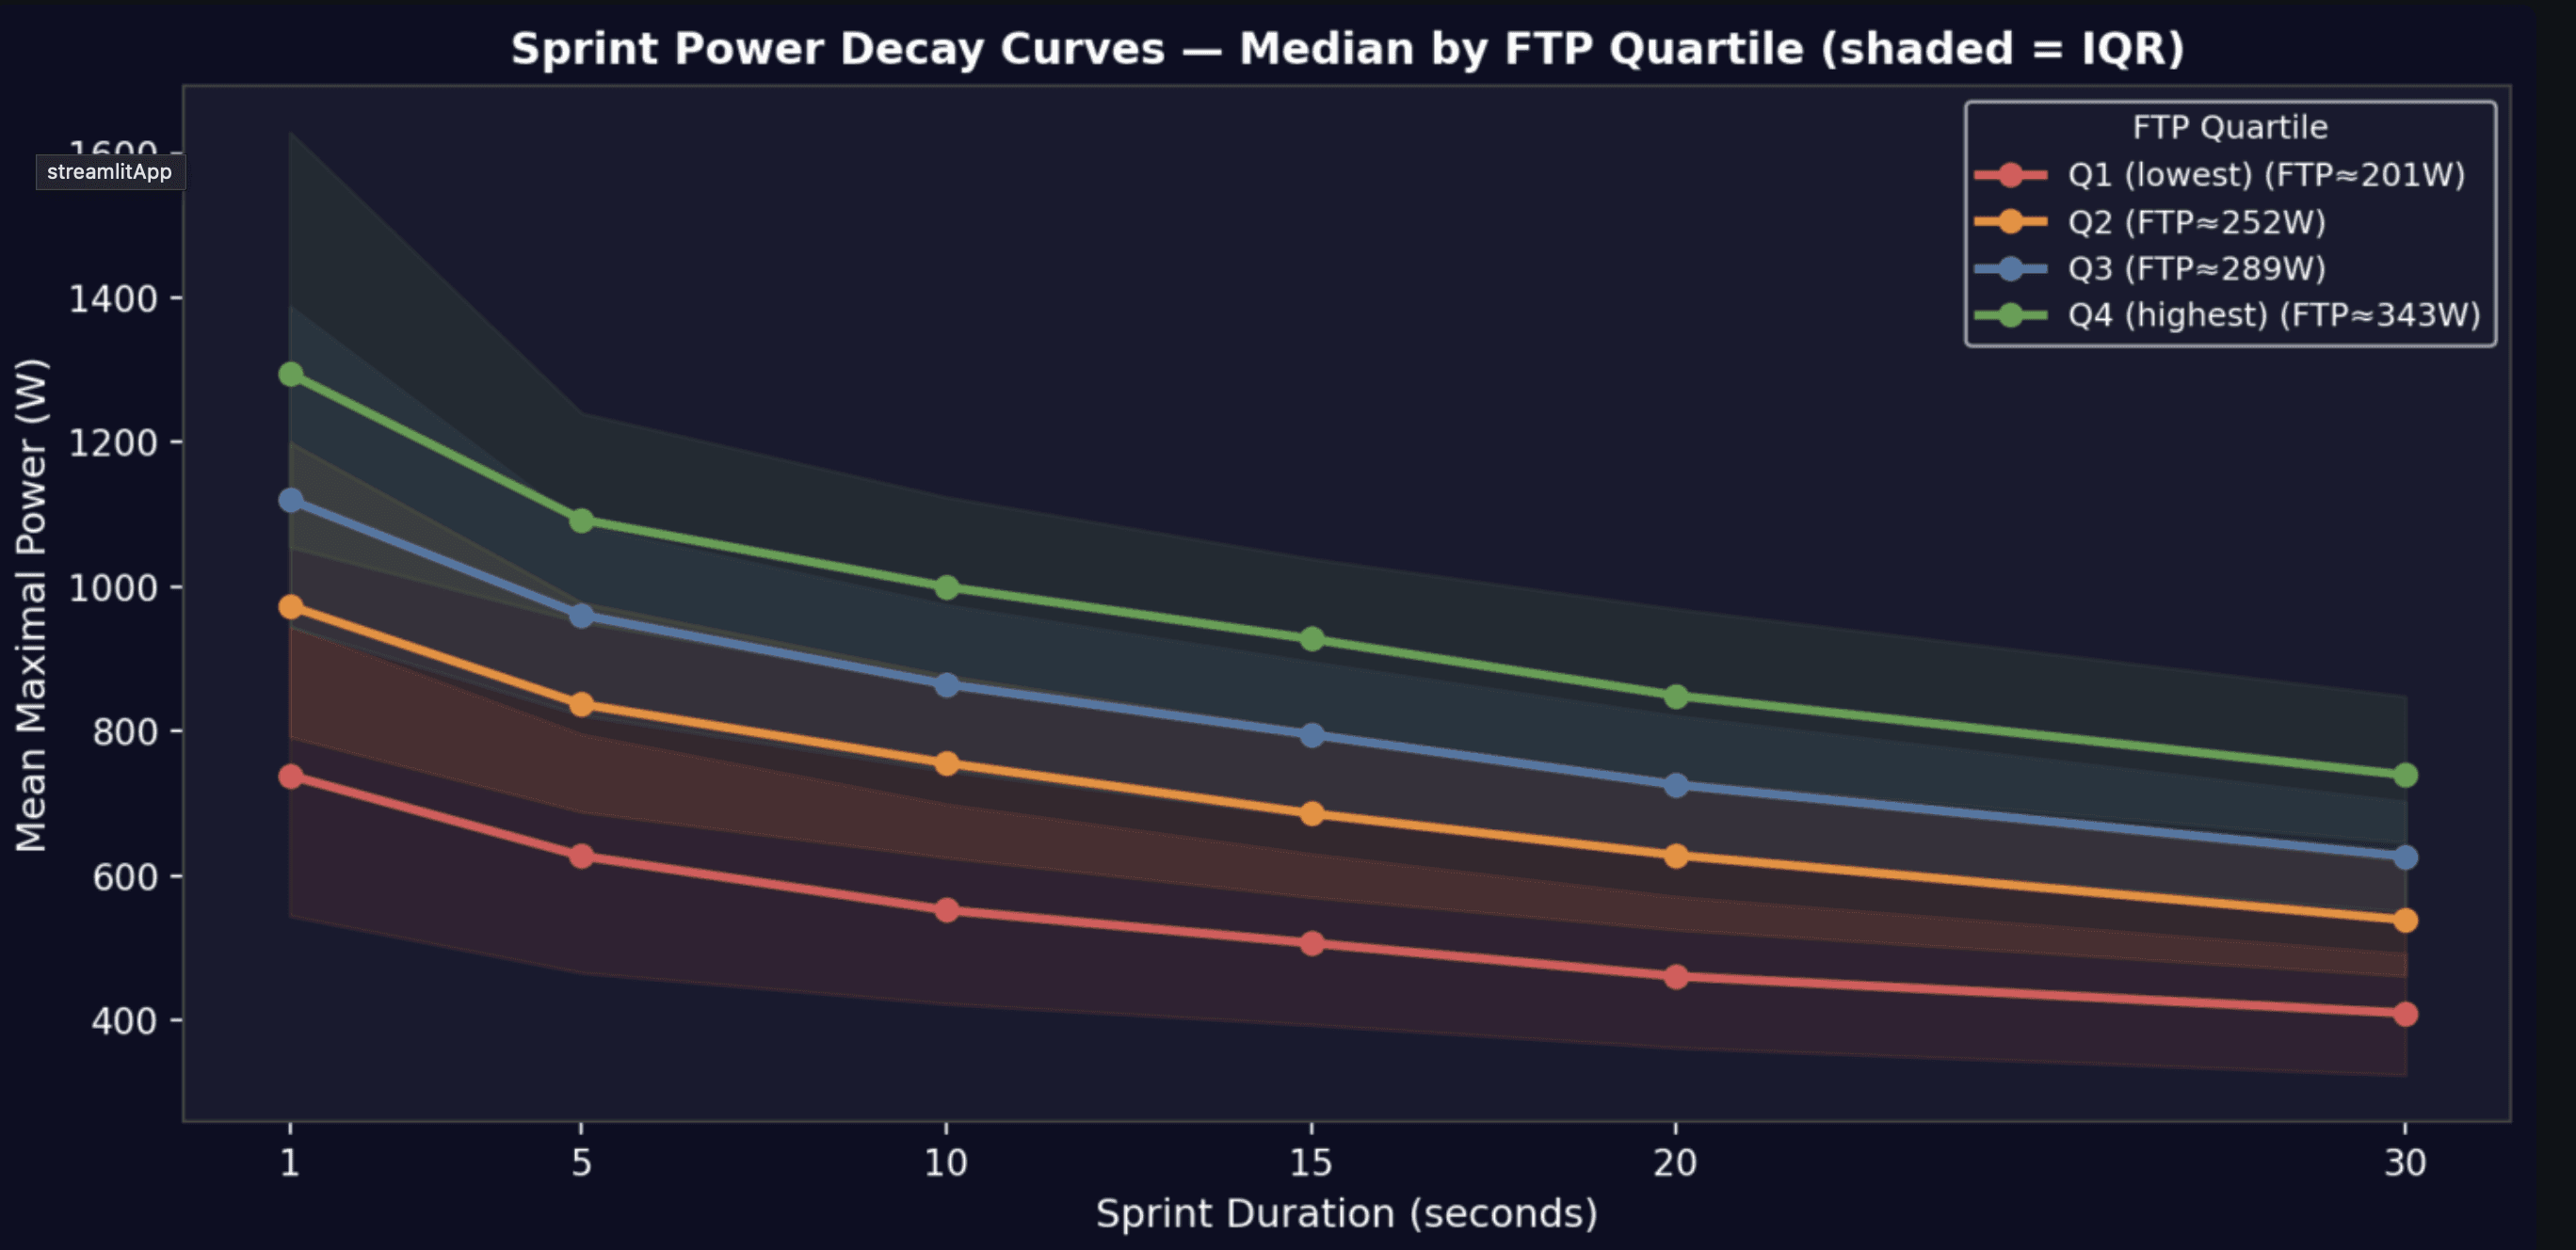
The features available for prediction fall into three groups: (1) six raw sprint power readings from the MMP curve (best 1s, 5s, 10s, 15s, 20s, and 30s average power), which are the primary inputs for the sprint prediction thesis; (2) nine engineered features capturing the shape of the sprint power-duration curve — fatigue index (30s/1s ratio), early/mid/late decay ratios, anaerobic reserve (1s−30s absolute loss), decay curvature, and power-to-weight ratios at key sprint durations; and (3) three biometric features (body weight in kg, age, gender).
Approach & Key Findings
Six machine learning models were trained on a primary 18-feature set sprint_bio: (six sprint power readings + nine engineered decay/ratio features + three biometrics), using a stratified 70/30 train-test split (3,338 train / 1,430 test athletes) with 5-fold cross-validation for hyperparameter tuning.
Models ranged from OLS Linear Regression (baseline) through Ridge/Lasso regularization, Decision Tree (GridSearchCV), Random Forest and XGBoost (RandomizedSearchCV), and a Keras MLP neural network. All models predict log(FTP) during training and back-transform to watts for evaluation — this normalization addresses the mild right skew in FTP and prevents negative predictions.
The best sprint-only models (XGBoost and Random Forest, which effectively tie) achieve R² ≈ 0.52 and MAE ≈ 33W — a statistically significant and practically useful prediction, but not a replacement for an FTP test.
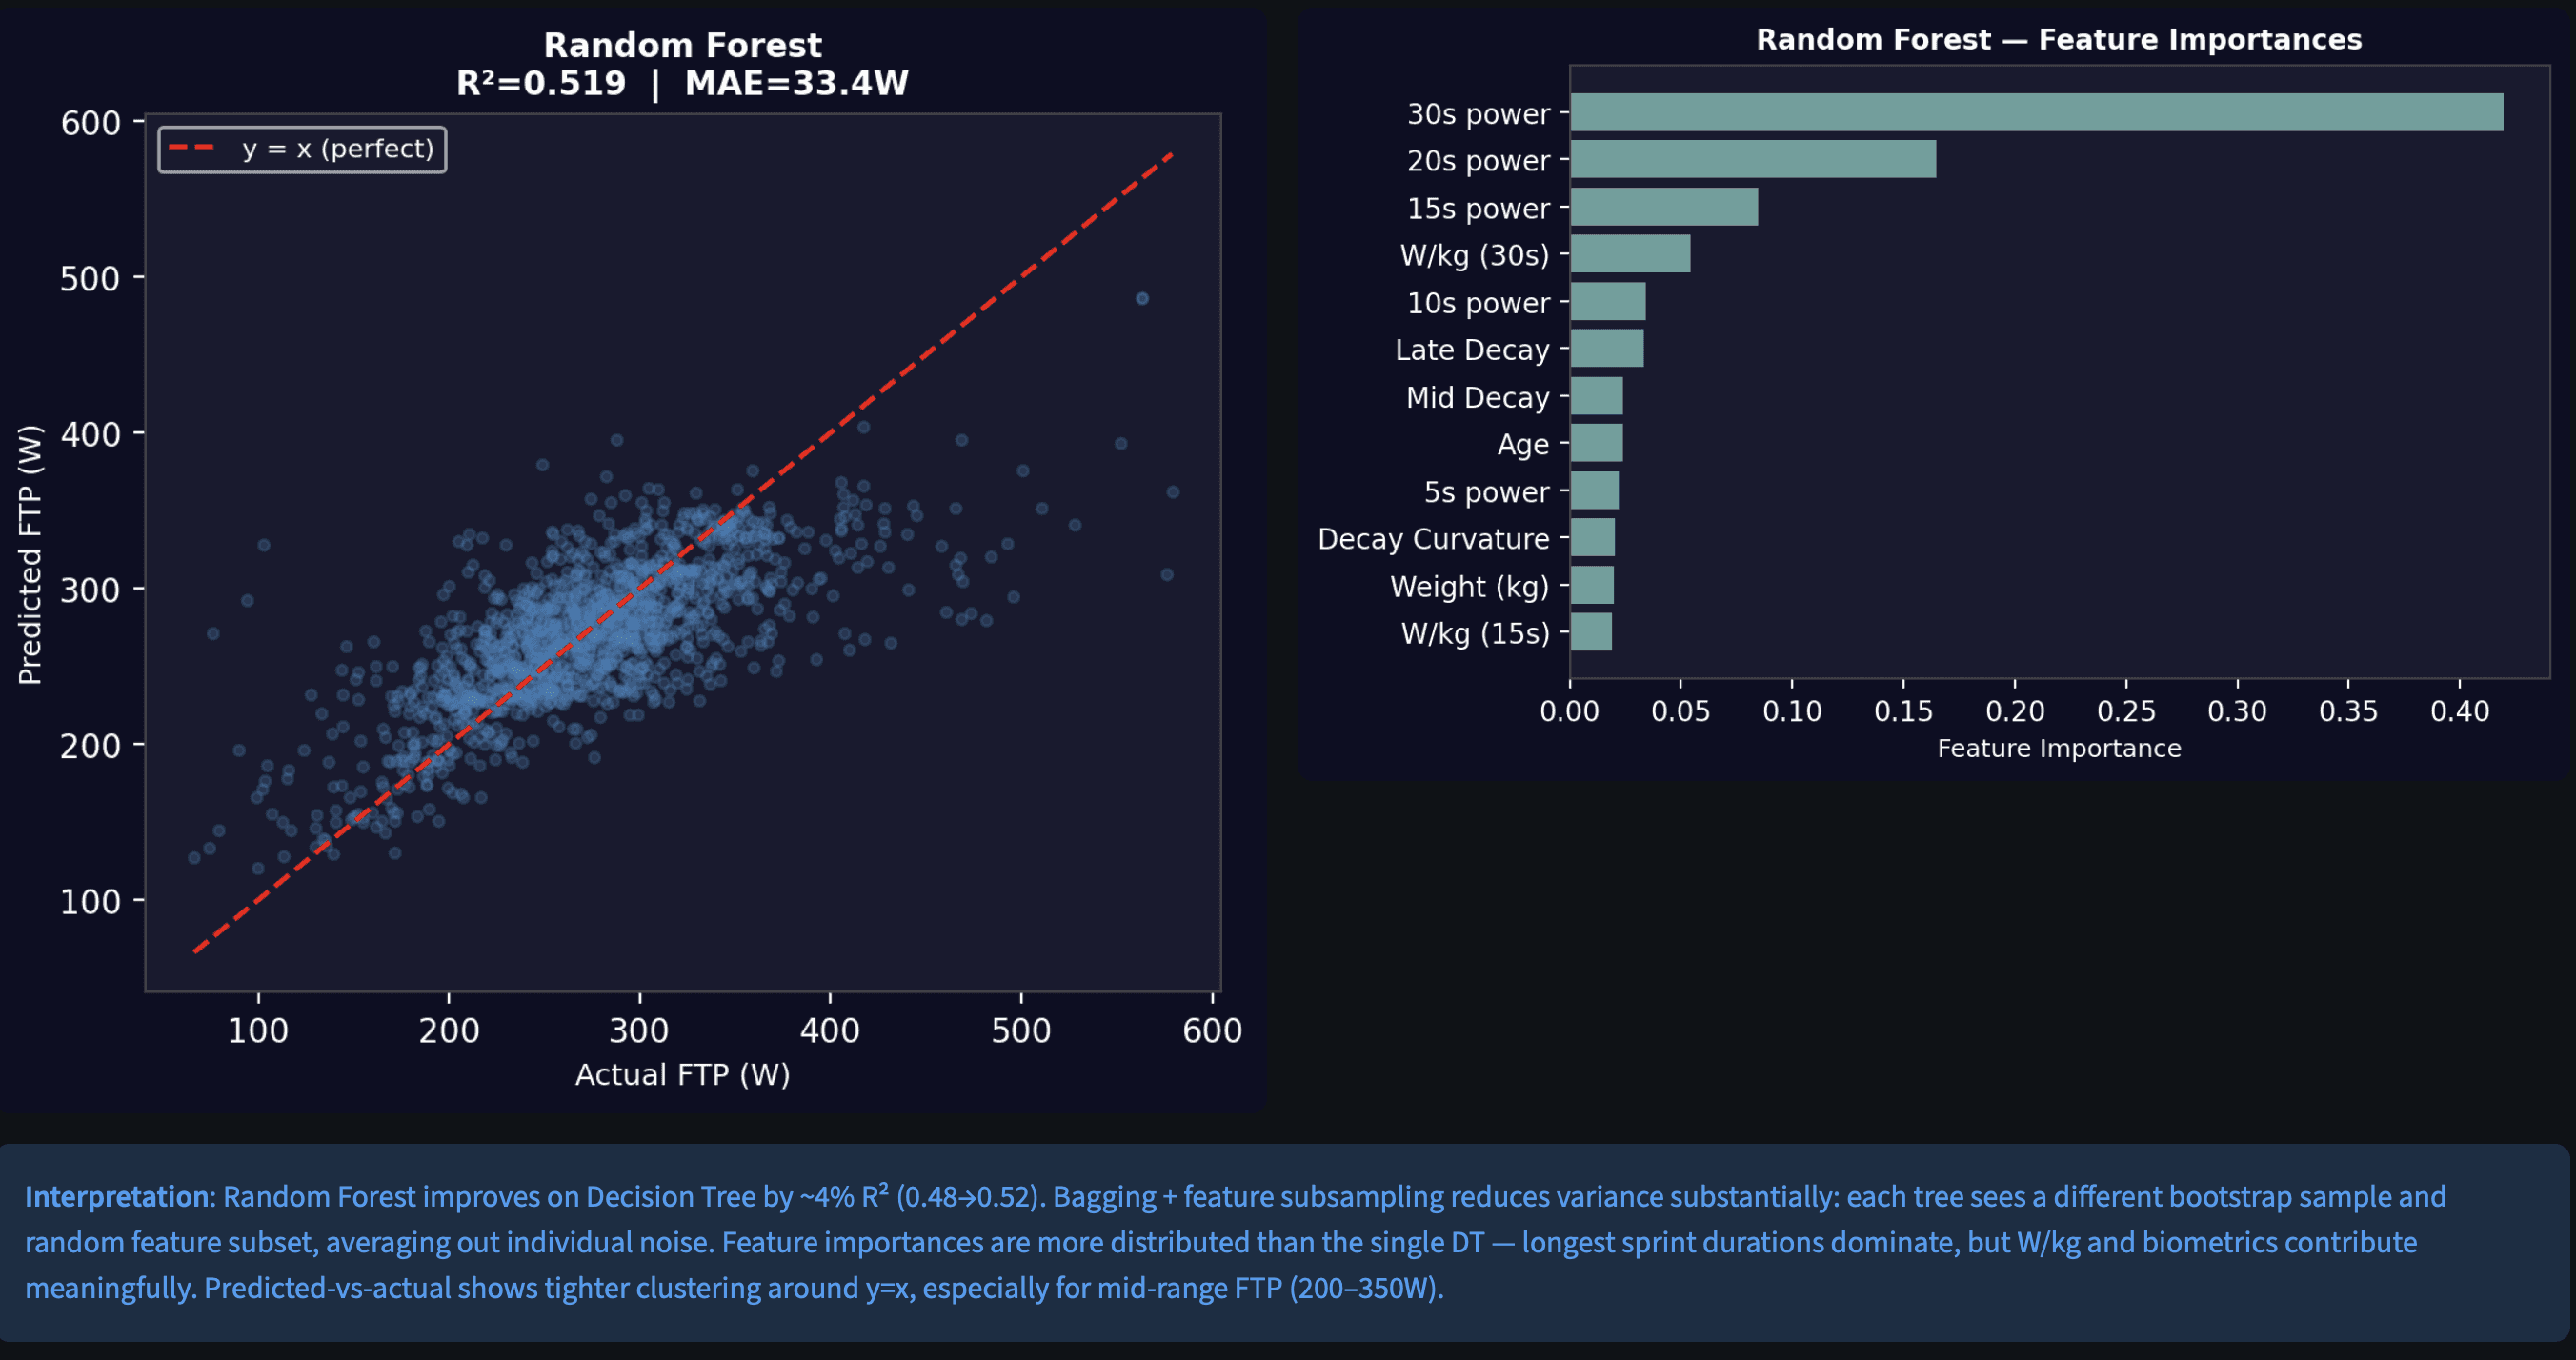
A SHAP analysis identifies 30s_critical_power as the single most important feature by a factor of ~6× over any other, confirming the thesis that longer sprint durations engage aerobic metabolism progressively more. Pearson correlation increases monotonically from r = 0.44 (1s) to r = 0.68 (30s) — the 30-second effort is the best sprint predictor of FTP.
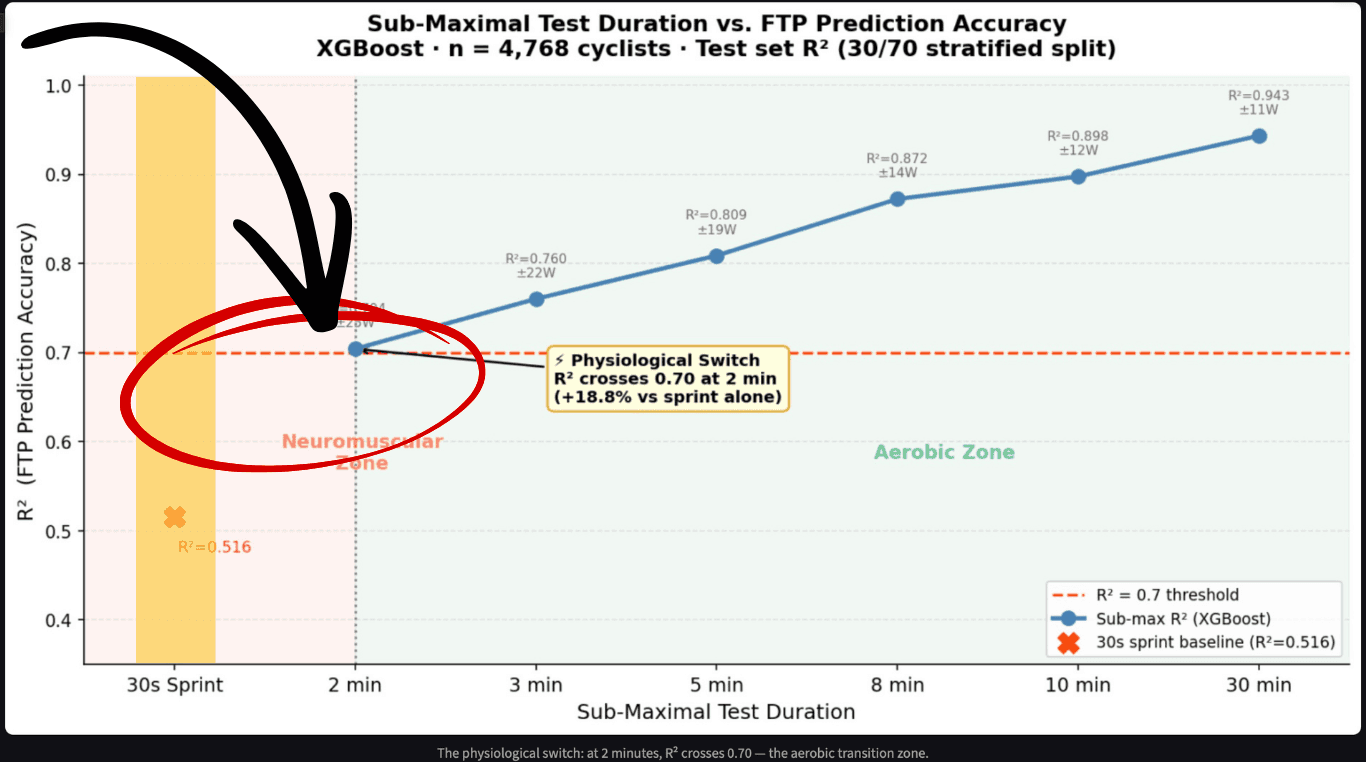
The central finding of the project is the physiological switch point at 2 minutes. A separate ablation study tested adding progressively longer sub-maximal effort data to the sprint feature set.
Adding just the 2-minute critical power to sprint features jumps R² from 0.52 to 0.70 — a +18 percentage point gain that represents the transition from anaerobic/sprint physiology to aerobic metabolism as the dominant predictor of FTP.
This aligns with exercise science: at ~75 seconds, aerobic and anaerobic ATP contributions are roughly equal (Gastin 2001); by 2 minutes, the aerobic system supplies ~65% of energy demand (Medbø & Tabata). A 2-minute field test could achieve 70% accuracy in FTP estimation — significantly easier than a 20-minute test — making it a viable screening tool for coaches performing large-group assessments or remote athlete monitoring.
Bottom line for non-technical readers: You can estimate a cyclist's FTP from a 30-second sprint with 52% explained variance and ~33W average error. That's useful — but the real insight is that extending the effort to just 2 minutes more than halves the unexplained variance.
The sprint captures neuromuscular power; the 2-minute effort captures the aerobic engine. Together, they locate each athlete on a sprint-to-endurance continuum that has direct implications for training design.
See the full report for comprehensive physiological analysis and potential applications.
The report argues that the gap between 30-second sprint power and 2-minute power is a more useful analytic signal than either number in isolation — particularly as a predictor of FTP (20-minute threshold power).
The core finding: 2-minute power explained substantially more variance in FTP than 30-second sprint power. The reason isn't just "longer = more relevant" — it's that these two durations tap fundamentally different physiology. 30-second efforts are dominated by phosphocreatine and glycolytic energy systems. 2-minute efforts push into the severe-intensity domain, where VO₂ kinetics, critical power constraints, and aerobic support become central. That transition between the two durations is where interesting things happen.
year
2026
timeframe
7 days
tools
PyTorch, Streamlit
category
Data Science