30sec Sprint to 20min FTP Delta and its Signal

The 30-Second vs 2-Minute Power Delta as a Signal for Adaptive Training Design in Cyclists
In cycling performance analysis, short-duration tests are often used as proxies for broader physiological capacity. But not all short efforts represent the same system demands, and treating them interchangeably can blur meaningful differences in athlete phenotype.
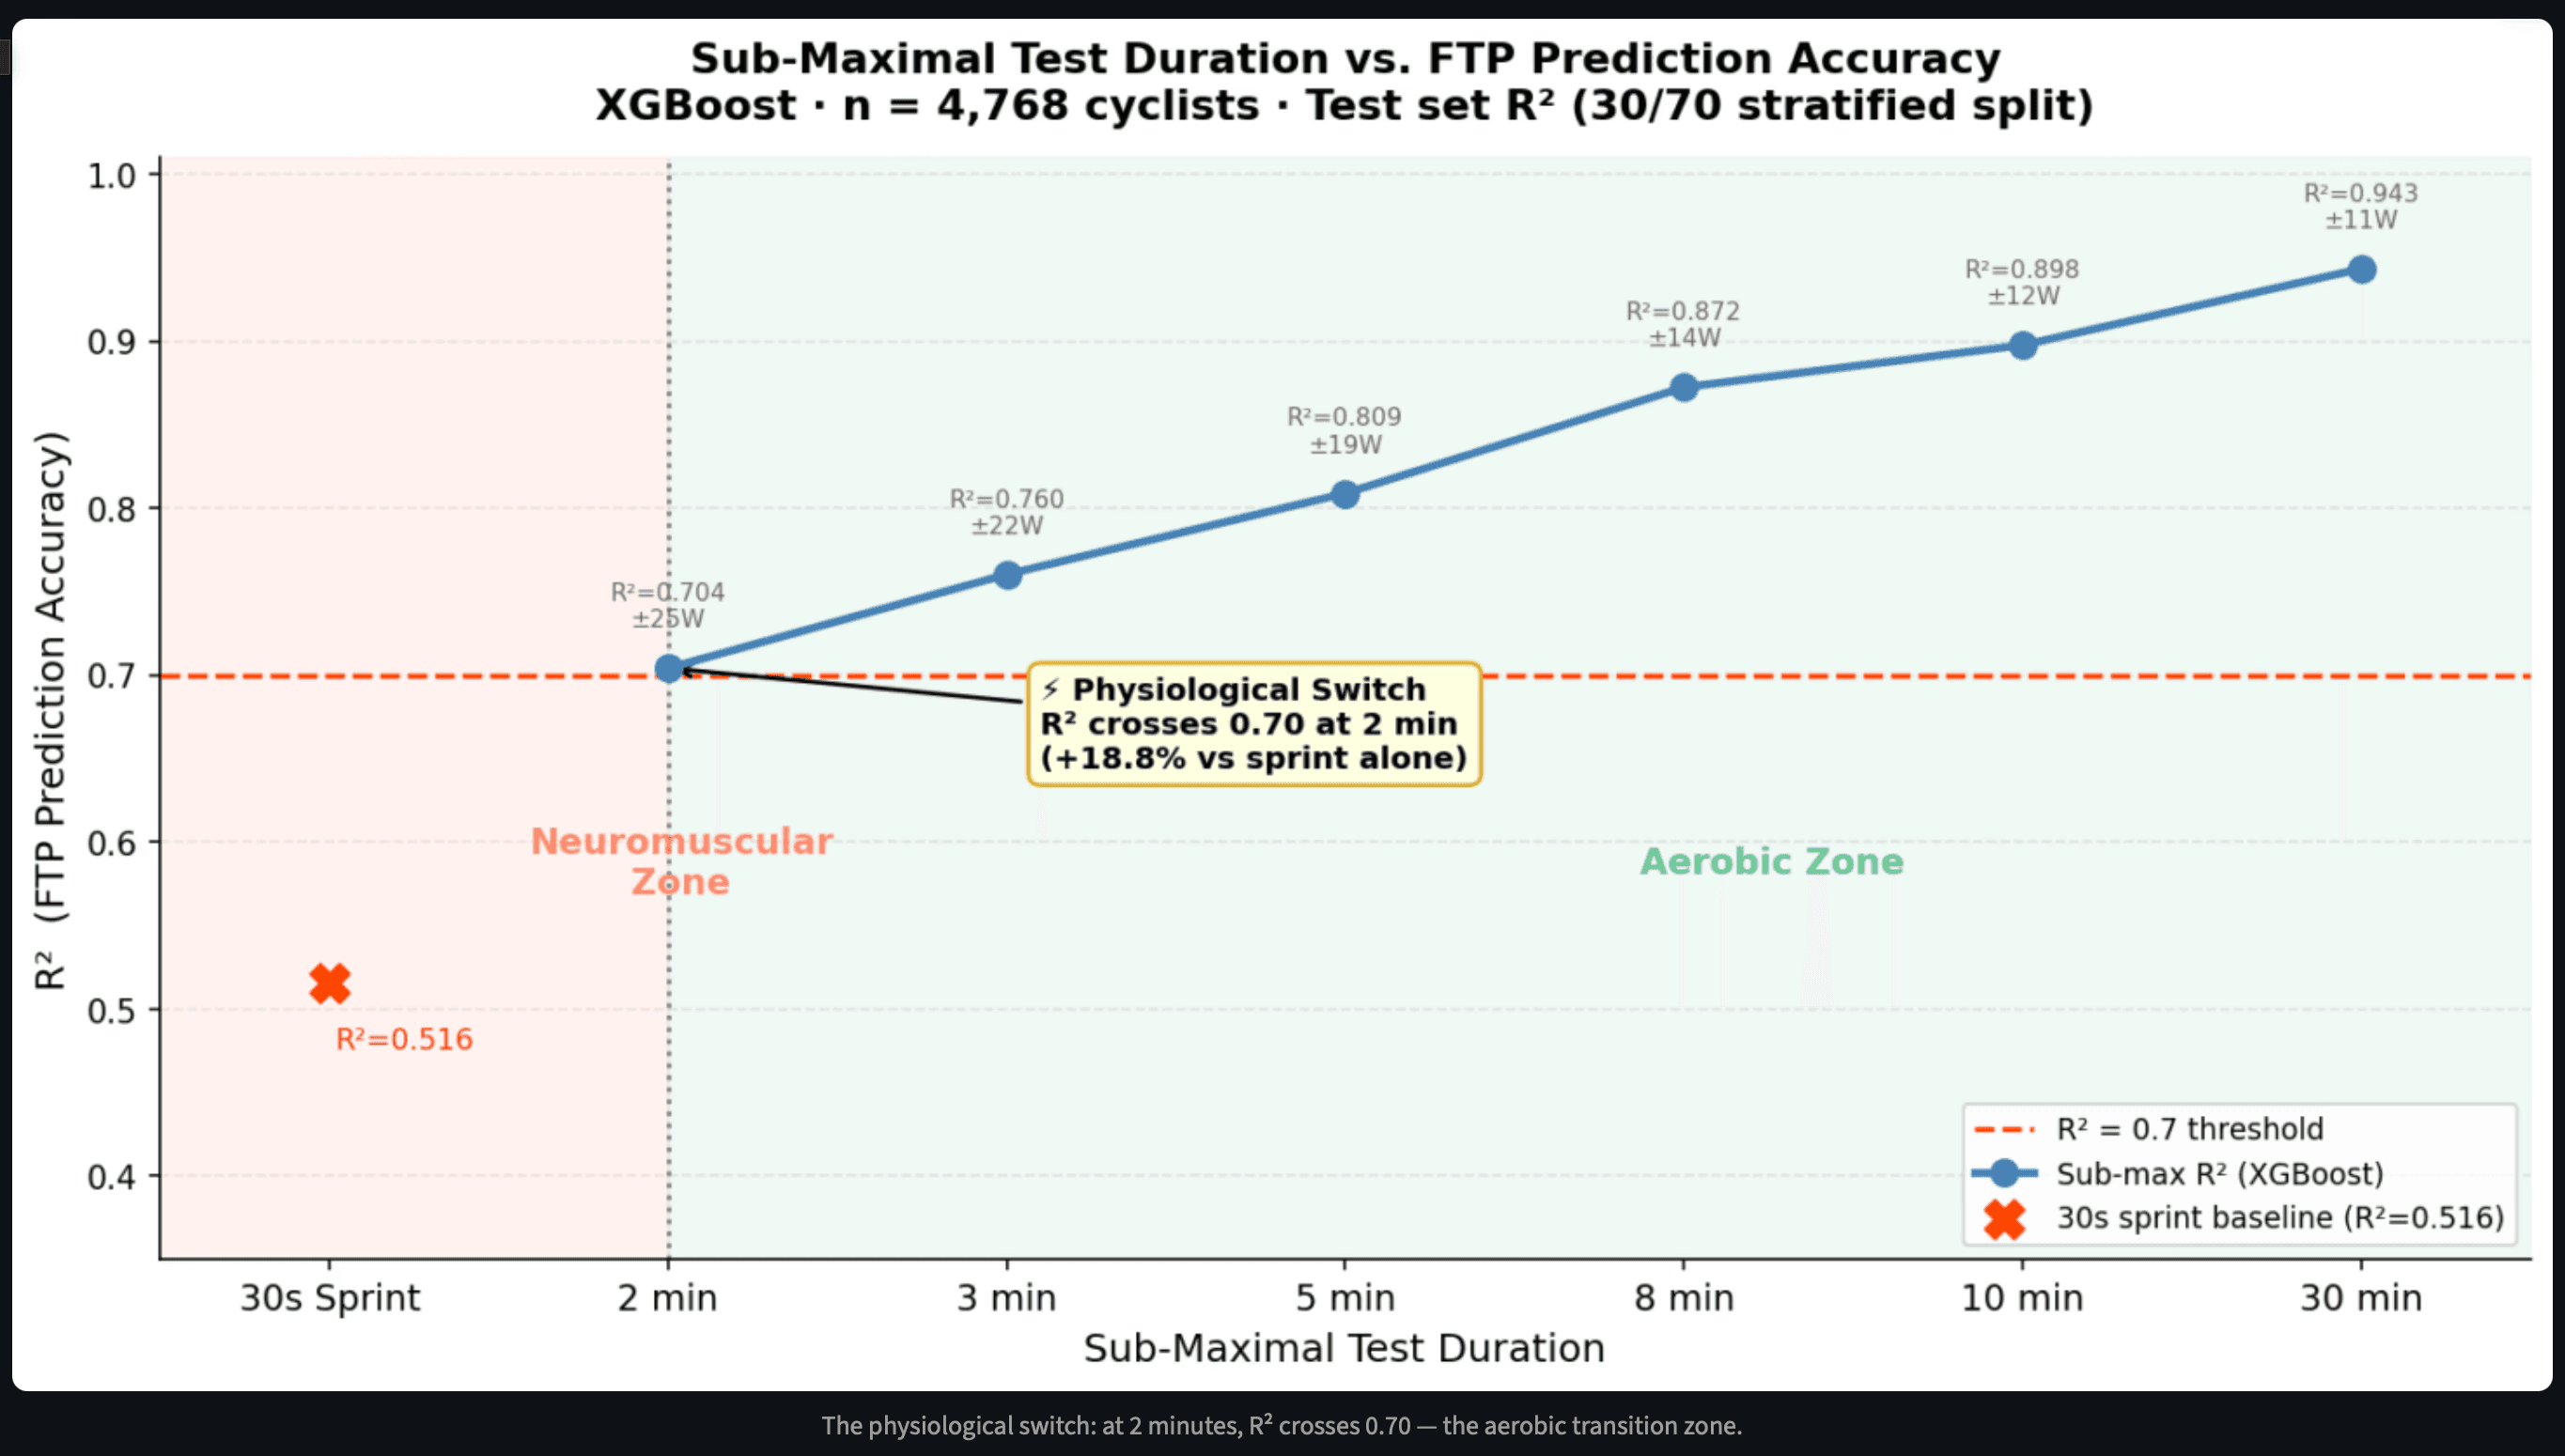
My recent analysis found that 2-minute power explained substantially more variance in 20-minute FTP than 30-second sprint power. The interpretation is not simply that “longer is better,” but that the performance determinants begin to shift materially between these two durations. That shift creates a useful analytic signal: the delta between 30-second and 2-minute power may help identify how an athlete transitions from explosive power expression into metabolically supported, fatigue-limited output.
From a performance data perspective, this matters because it offers a compact way to move beyond single-number profiling. Rather than looking only at FTP, peak power, or power-duration curve snapshots in isolation, the 30s–2min relationship may help quantify how an athlete produces power across a key physiological transition zone.
Why 30 seconds and 2 minutes are fundamentally different tests
A 30-second all-out effort is typically interpreted as a high-anaerobic-demand task, with substantial contribution from phosphocreatine breakdown, glycolytic flux, and neuromuscular power production. Although aerobic metabolism is not absent during a 30-second sprint, the effort is still dominated by rapid energy turnover mechanisms that support maximal short-duration output. Classic sprint physiology work shows that phosphocreatine availability is especially important for preserving very high power output early in the effort, while glycolytic and oxidative contribution rise as the sprint progresses.
By contrast, a 2-minute effort sits in a very different metabolic and regulatory context. This duration lies much closer to the severe-intensity domain, where oxygen uptake kinetics, the VO₂ slow component, critical power-related constraints, and rapid fatigue development become central to performance. Above critical power, VO₂ does not stabilize in a steady state; instead, it continues rising toward VO₂max until intolerance is reached. That makes efforts in this range especially informative for understanding an athlete’s ability to translate initial power into sustained, system-supported output.
In other words, the difference between 30 seconds and 2 minutes is not merely a difference in duration. It is a difference in which physiological mechanisms become performance-limiting.
The physiological meaning of the delta
The practical value is not only in the individual test outcomes, but in the gap between them.
A large 30-second value paired with a much lower relative 2-minute value may indicate an athlete whose performance is weighted toward neuromuscular force production and short-duration anaerobic expression, but who loses power rapidly once oxidative support, metabolic stability, and severe-domain tolerance become more important. Conversely, an athlete with a smaller drop from 30 seconds to 2 minutes may be better able to preserve output as aerobic contribution rises and fatigue mechanisms accumulate.
This interpretation is consistent with the broader literature on exercise intensity domains. VO₂ kinetics research shows that exercise responses differ meaningfully depending on whether work is performed in the moderate, heavy, very heavy, or severe domain, and that above threshold regions, delayed oxygen kinetics and the VO₂ slow component become key features of the physiological response.
That means the 30s–2min delta can function as a compact performance marker of transition efficiency: how effectively an athlete carries power from explosive expression into high-intensity sustainable output.
Why this is useful for adaptive training systems
From a data systems standpoint, adaptive training works best when it responds not just to absolute fitness, but to where the athlete’s constraints are showing up. The 30s–2min delta appears valuable precisely because it may reveal one of those constraints.
Two cyclists with identical FTPs can arrive there through very different physiological profiles. One rider may have strong sprint power and weak durability once the effort leaves the purely explosive range. Another may show less peak explosiveness but better preservation of power as oxidative contribution ramps and metabolic stress accumulates. A single FTP value masks that distinction.
The delta helps expose it.
This creates a more useful basis for athlete segmentation within an adaptive model. Rather than grouping riders only by threshold power, a performance data system could classify them by how sharply power decays between short maximal efforts and severe-domain efforts. That classification could then be used to inform how workloads are interpreted, which adaptations are prioritized, and how training responses are monitored over time.
For example, if an athlete’s 30-second power remains strong while 2-minute power lags or stagnates, that may indicate improvement in maximal output without equivalent gains in aerobic support, severe-domain tolerance, or power preservation. If the delta narrows over time, it may suggest better integration between short-duration power and metabolically supported performance.
The point is not to prescribe workouts directly from the metric. The point is that the metric can improve the analytic logic behind adaptation.

A studio perspective: from metric to model
For a performance data studio, the 30s–2min delta is appealing because it is not just another descriptive number. It can be operationalized.
At minimum, a system could track:
absolute 30-second power
absolute 2-minute power
the ratio between them
the percentage drop from 30 seconds to 2 minutes
how that relationship changes across blocks, race phases, or fatigue states
Over time, that signal can be layered against FTP, heart rate response, interval completion quality, training load, and recovery markers to test higher-order questions:
Does a narrowing 30s–2min gap precede gains in FTP?
Do athletes with larger deltas respond differently to VO₂-focused blocks than athletes with smaller deltas?
Does the delta change under accumulated fatigue before FTP changes are visible?
Can the delta improve classification of rider phenotype beyond peak power and threshold alone?
These are useful questions because they move training analytics away from static benchmarking and toward dynamic profiling.
Why 2-minute power may align more closely with FTP-related performance
The likely reason 2-minute power tracks FTP better than 30-second power is that it captures more of the same performance architecture that underpins sustained efforts.
Endurance performance is constrained not only by maximal oxygen uptake, but also by the ability to deliver oxygen, utilize it efficiently, and sustain a high fractional utilization over time. Reviews on endurance physiology consistently show that aerobic transport capacity, mitochondrial adaptation, and fatigue-related efficiency losses are central to longer-duration performance outcomes.
A 2-minute effort does not replicate a 20-minute effort, but it begins to sample this terrain more directly than a sprint does. It forces the athlete into a domain where oxygen kinetics, metabolic instability, and tolerance to severe work rates become much more relevant. That makes it a better candidate for predicting FTP-adjacent performance, and it also explains why the difference between 30-second and 2-minute power may be analytically meaningful.
Implications for future performance analytics
The broader implication is that performance modeling in cycling may benefit from paying more attention to transitions between durations, not just isolated test points.
Most testing frameworks still emphasize standalone values: peak sprint power, 1-minute power, FTP, critical power, VO₂max. Those are all useful, but the relationships between them may contain equally important information. In particular, the drop from 30 seconds to 2 minutes appears to reflect a shift from predominantly explosive power determinants toward severe-domain endurance constraints.
That makes it a promising feature for:
athlete profiling
training block evaluation
adaptive model inputs
longitudinal monitoring of phenotype shifts
early detection of mismatches between raw power and usable sustained output
For analysts and builders working in performance technology, this is the more interesting possibility. The value is not that the metric replaces FTP or critical power, it is that it adds structure to how we interpret performance variation across the power-duration curve.
Conclusion
The 30-second vs 2-minute power delta offers a useful lens on a key physiological transition in cycling: the move from short-duration explosive output toward metabolically supported, fatigue-limited performance.
From a performance data studio perspective, that makes it more than a testing curiosity. It is a potentially valuable analytic feature for understanding rider phenotype, interpreting adaptation, and improving how adaptive systems classify performance constraints. The strongest use case is not direct workout prescription, but better modeling: using the delta to explain why athletes with similar headline metrics may require different interpretations, different monitoring logic, and different pathways of progression.
As performance analytics continues to move beyond single-value fitness markers, duration-to-duration relationships like this one may become increasingly important. The future of adaptive training may depend less on asking, “What is this athlete’s FTP?” and more on asking, “How does this athlete carry power as physiology shifts across the curve?”
Supportive research
Bogdanis et al. showed that during repeated 30-second sprint exercise, phosphocreatine availability is especially important for high early power output, while aerobic metabolism contributes substantially as the effort continues.
Bogdanis, G. C., Nevill, M. E., Boobis, L. H., & Lakomy, H. K. A. (1996). Contribution of phosphocreatine and aerobic metabolism to energy supply during repeated sprint exercise. Journal of Applied Physiology, 80(3), 876–884.
Jones et al. describe critical power as the highest rate of oxidative energy transduction that can be sustained without continual depletion of finite work capacity above critical power, making it a useful framework for interpreting fatigue and severe-intensity exercise.
Jones, A. M., Vanhatalo, A., Burnley, M., Morton, R. H., & Poole, D. C. (2010). Critical power: Implications for the determination of VO2max and exercise tolerance. Medicine & Science in Sports & Exercise, 42(10), 1876–1890.
Poole et al. explain that above critical power, VO₂ does not stabilize and instead continues to rise toward VO₂max, reinforcing why efforts in the 2-minute range can reflect different system constraints than sprint efforts.
Poole, D. C., Burnley, M., Vanhatalo, A., Rossiter, H. B., & Jones, A. M. (2016). Critical power: An important fatigue threshold in exercise physiology. Medicine & Science in Sports & Exercise, 48(11), 2320–2334.
Bassett and Howley summarize how endurance performance depends on oxygen delivery, utilization, and submaximal metabolic adaptations, not just short-duration maximal output.
Bassett, D. R., Jr., & Howley, E. T. (2000). Limiting factors for maximum oxygen uptake and determinants of endurance performance. Medicine & Science in Sports & Exercise, 32(1), 70–84.
date published
Mar 7, 2026
reading time
5 min read