I Built a Thing: Visualizing Supplement Stacking for Cycling Sprint Performance

How I turned PubMed meta-analyses into an interactive protocol tool — and why it matters for what I’m building next.
Many cyclists I know stack caffeine and beta-alanine before hard efforts. Almost none of them can tell you why the combination works, when each compound peaks, or how to time the two so they actually overlap on race day.
The research exists. It’s buried in journal articles most athletes will never read. So I built a tool that makes it visible.
Supplement Intelligence is an interactive dashboard that models the stacking effect of caffeine and beta-alanine for cycling anaerobic sprint protocols. It’s built with React and sourced entirely from PubMed-indexed RCTs and meta-analyses.
What the Dashboard Covers
The tool is structured in three sections that build on each other: individual compound analysis, then the compound effect.
I. Caffeine: Dose-Response & Timing
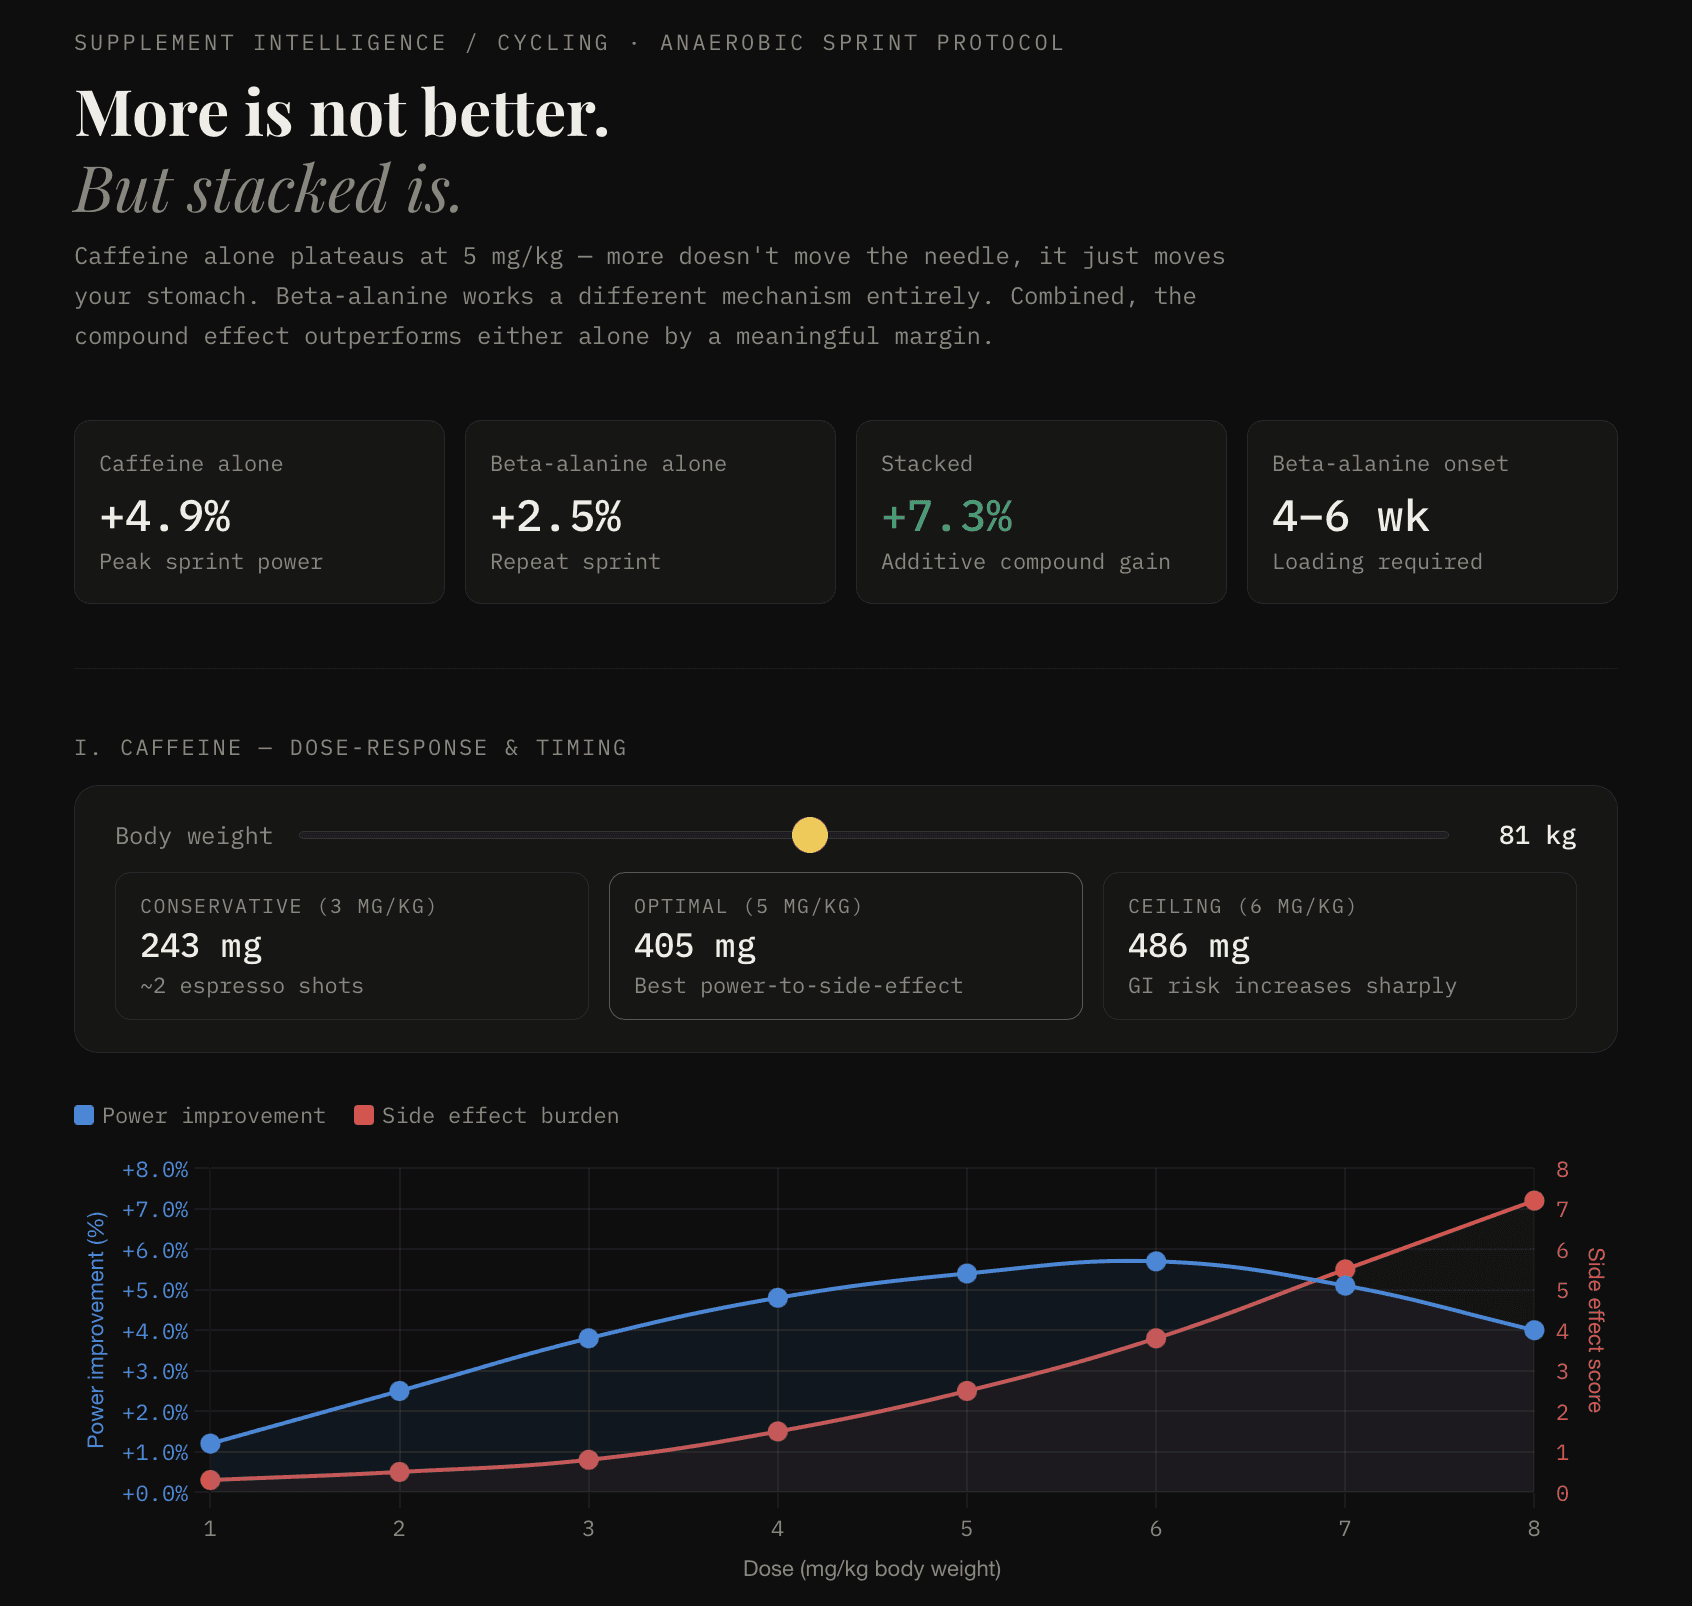
A body-weight-adjusted dosing calculator that maps three tiers — conservative (3 mg/kg), optimal (5 mg/kg), and ceiling (6 mg/kg) — against a dual-axis chart showing power improvement on one axis and side effect burden on the other. The visual makes the diminishing returns obvious: past 5 mg/kg, you’re buying GI distress without meaningful power gains.
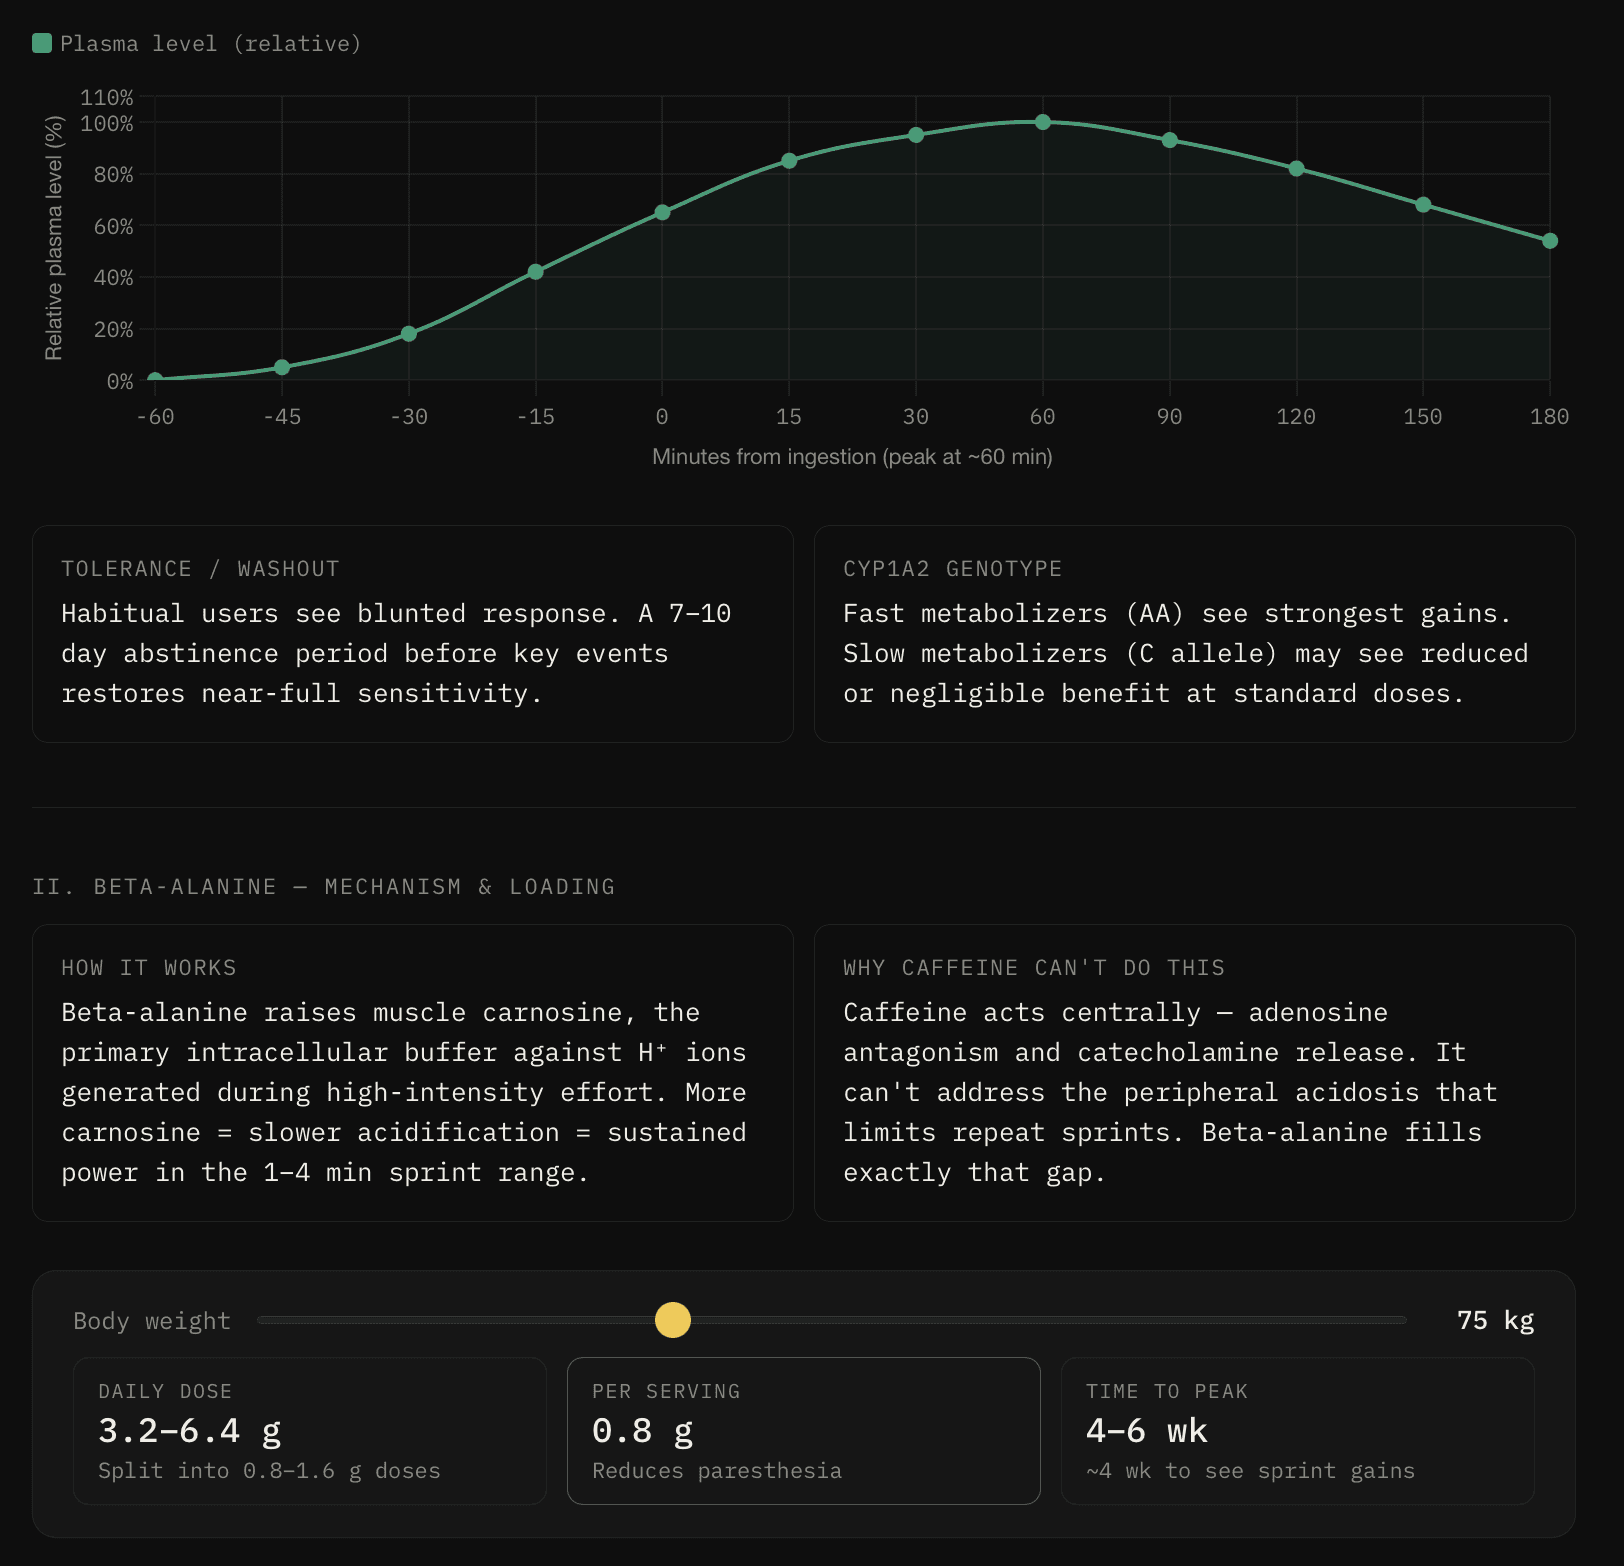
The section also covers two variables most athletes ignore: caffeine tolerance and washout (habitual users see blunted responses; a 7–10 day abstinence period before key events restores near-full sensitivity) and CYP1A2 genotype (fast metabolizers with the AA variant see the strongest gains, while slow metabolizers carrying the C allele may see reduced or negligible benefit at standard doses).
II. Beta-Alanine: Mechanism & Loading
This section explains why caffeine can’t do what beta-alanine does. Caffeine acts centrally — adenosine antagonism and catecholamine release. It can’t address the peripheral acidosis that limits repeat sprints. Beta-alanine fills that gap by raising muscle carnosine levels, buffering the H⁺ ions that accumulate during high-intensity effort.
The loading protocol is body-weight-adjusted with a carnosine accumulation curve showing the 4–6 week timeline to peak levels. It also addresses paresthesia — the tingling sensation that makes athletes think something is wrong. It’s harmless, and the dashboard explains how to manage it with dose splitting.
III. Compound Effect: Stacking the Two
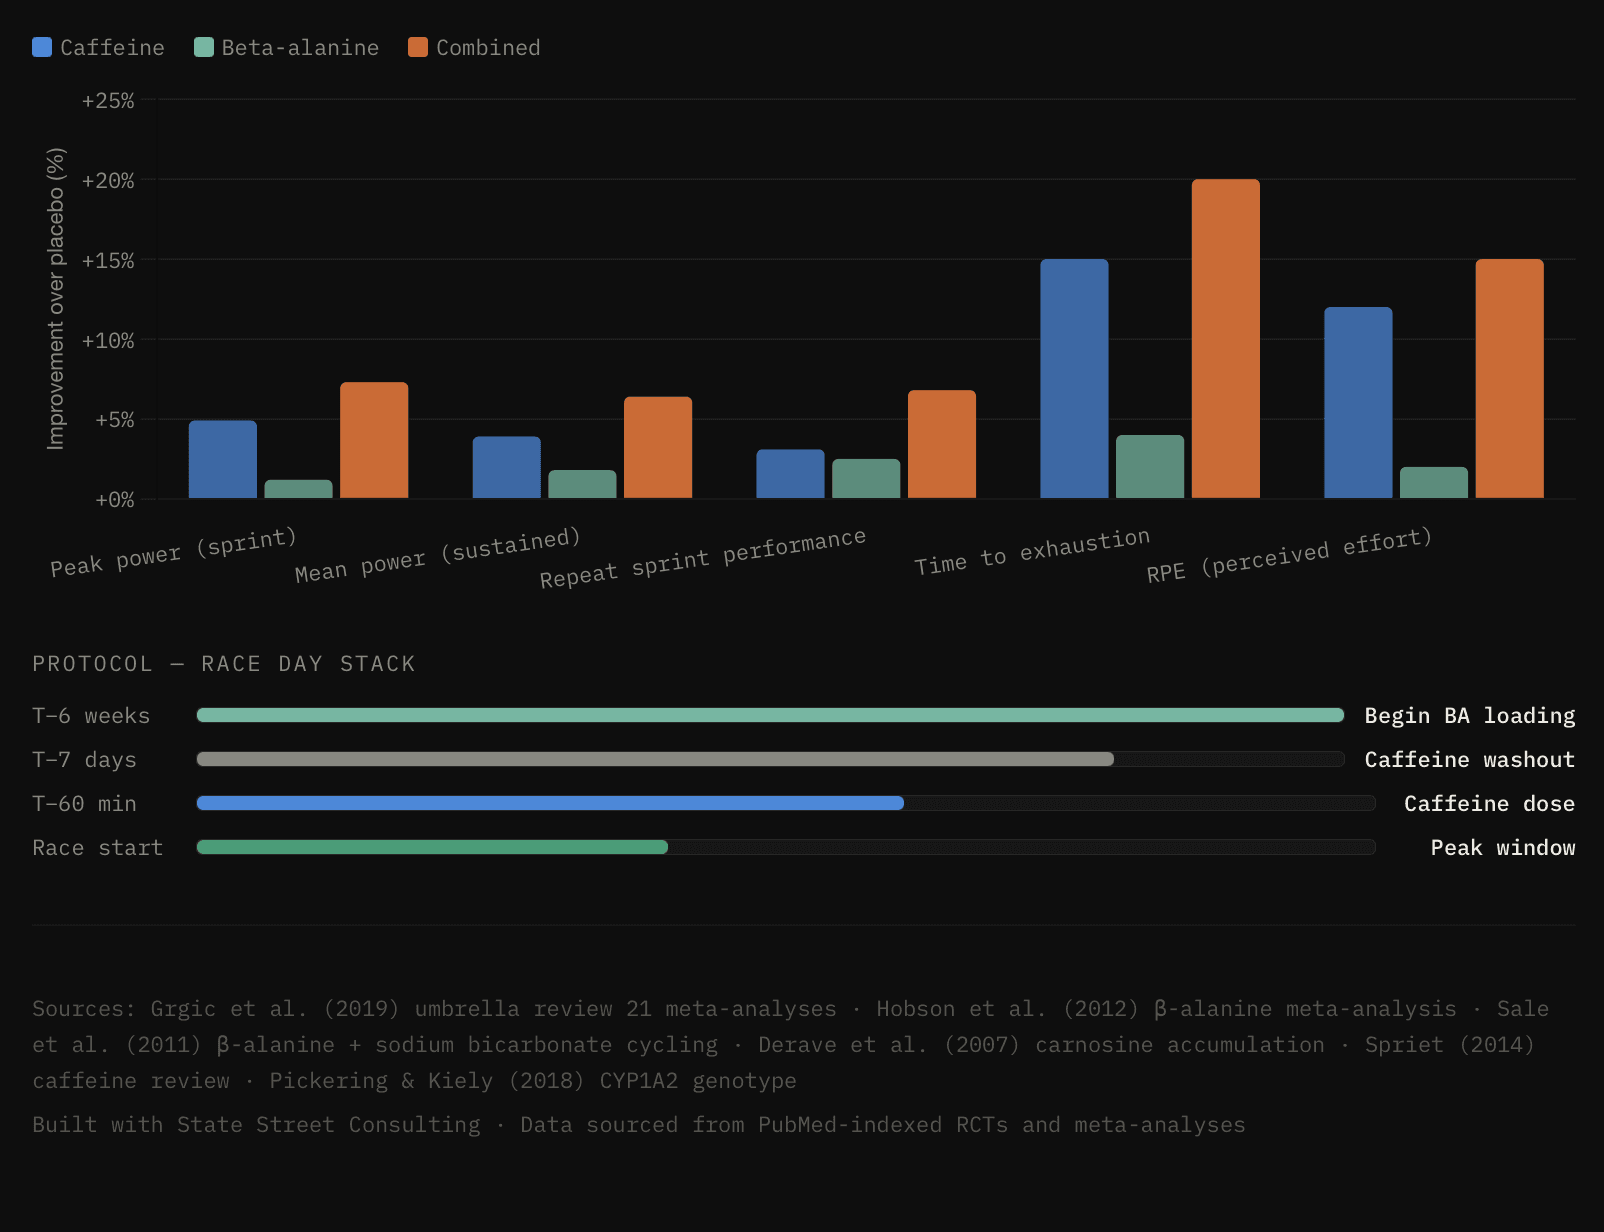
This is the payoff. A grouped bar chart compares caffeine alone, beta-alanine alone, and the combined stack across five performance metrics:
Peak power (sprint) — caffeine dominant
Mean power (sustained) — combined advantage
Repeat sprint performance — beta-alanine’s territory
Time to exhaustion — strongest combined effect
RPE (perceived effort) — meaningful reduction when stacked
The headline numbers: caffeine alone delivers roughly +4.9% peak sprint power. Beta-alanine alone adds about +2.5% to repeat sprint capacity. Stacked, the additive gain reaches approximately +7.3%. The mechanisms don’t overlap — central nervous system activation plus peripheral acidosis buffering — which is precisely why the stack is additive rather than redundant.
A race day protocol timeline closes the section: begin beta-alanine loading at T-6 weeks, start caffeine washout at T-7 days, dose caffeine at T-60 minutes, and hit the start line inside the peak performance window.
Why I Built This
I’m a privateer motorcycle racer and endurance athlete. I’ve been stacking these two compounds for years — sometimes well, sometimes by feel. The frustration wasn’t lack of information. It was lack of visible, actionable information. The studies exist. The dosing data is published. Nobody had made it interactive or body-weight-personalized.
But the deeper reason is that this dashboard is a proof point for something bigger I’m building.
The Bigger Picture: An Intelligence Layer for Performance Data
I’m developing a multi-agent AI system designed to connect wearable data, nutrition protocols, and biometric signals into something coaches and athletes can actually use. Not another dashboard that creates more data to ignore. An intelligence layer.
The system uses specialized agents — a data analyst, a performance nutritionist, a biometric optimizer — each with domain-specific knowledge and methodology frameworks. The supplement dashboard is one interface for one narrow question. The architecture behind it is designed to handle the full stack of performance decision-making.
This connects to parallel work I’ve been doing with the GoldenCheetah OpenData dataset, building XGBoost models with SHAP analysis to predict cyclists’ peak power from sprint efforts. The supplement visualization makes the inputs legible. The ML work makes the outputs predictive. Together, they start to look like what I think the future of sports performance consulting actually is: research-grounded, data-driven, and personalized at the individual level.
Technical Notes
Stack: React, deployed on Vercel
Data sources: Grgic et al. (2019) umbrella review of 21 caffeine meta-analyses, Hobson et al. (2012) β-alanine meta-analysis, Sale et al. (2011) β-alanine and acidosis buffering in high-intensity cycling, Derave et al. (2007) carnosine accumulation, Spriet (2014) caffeine review, Pickering & Kiely (2018) CYP1A2 genotype
Interactive elements: Body-weight sliders for personalized dosing, dual-axis dose-response charting, carnosine accumulation curve, grouped bar comparison across five metrics, race day protocol timeline
What’s Next
More agents. More interfaces. The supplement dashboard covers one compound interaction for one sport modality. The system I’m building is designed to scale across compounds, across sports, and across the full decision surface that athletes and coaches navigate every day.
If you’re working at the intersection of sports science, wearable data, and applied ML — or if you’re an athlete or coach who’s tired of dashboards that give you data without telling you what to do with it — I’d like to hear from you.
Built by Ultrathon.io. Data sourced from PubMed-indexed RCTs and meta-analyses.
date published
Mar 15, 2026
reading time
5 min read