watts per kg
Stage 15 of the 2024 Tour de France featured one of the greatest mountain climbing performances ever recorded. This five-tab interactive dashboard synthesizes power data, physiology, and physics to explain how far apart three of the best riders in the world are — and why.
00
problem
Existing coverage of the Vingegaard–Pogačar–Jørgenson performance gap treated it as narrative rather than structure. VAM figures, weight data, and confirmed power outputs existed across multiple sources but had never been synthesized into a single argument that separated the physics penalty from the fitness gap.
solution
I built a five-tab interactive dashboard that constructs the case incrementally — power curve, w/kg decomposition, VAM historical register, physiological ceiling estimates, and a weight penalty model that quantifies a projected 2:31 per mountain stage. Ships as a React/Recharts component and a zero-dependency Chart.js HTML embed, with Claude Code automation scripts for Framer and Webflow deployment.
TLDR: Stage 15 of the 2024 Tour de France featured one of the greatest mountain climbing performances ever recorded. Three riders are at the center: Tadej Pogačar, the overall race winner and arguably the most dominant cyclist of his generation; Jonas Vingegaard, the defending champion and Pogačar's only real rival; and Matteo Jørgenson, a rising American-Danish rider who paced the front group for fifteen minutes before pulling off to let his team leader Vingegaard go.
This five-tab interactive dashboard synthesizes power data, physiology, and physics to explain how far apart these riders actually are — and why. Two key concepts make the analysis work. W/kg (watts per kilogram) is cycling's great equalizer: it measures power output relative to body weight, which is what determines how fast you go uphill. VAM (velocità ascensionale media) is vertical climbing speed in meters per hour — basically how fast you gain elevation. Pogačar and Vingegaard posted VAM numbers on Plateau de Beille that displaced records from the most controversial era in cycling history.
The core finding is structural, not narrative. Jørgenson produces more raw power than either rival, but at 70kg versus Vingegaard's 60kg, gradient physics impose a deficit of roughly 0.42 W/kg — translating to about 2:31 lost per mountain stage, compounding to 10–15 minutes across a three-week Grand Tour. The actual gap at the finish? 18:30. The dashboard builds this case incrementally across five tabs: power curve, W/kg decomposition, historical VAM register, physiological ceiling estimates, and a weight penalty model. Built in 4 days with React, Recharts, and Claude Code.
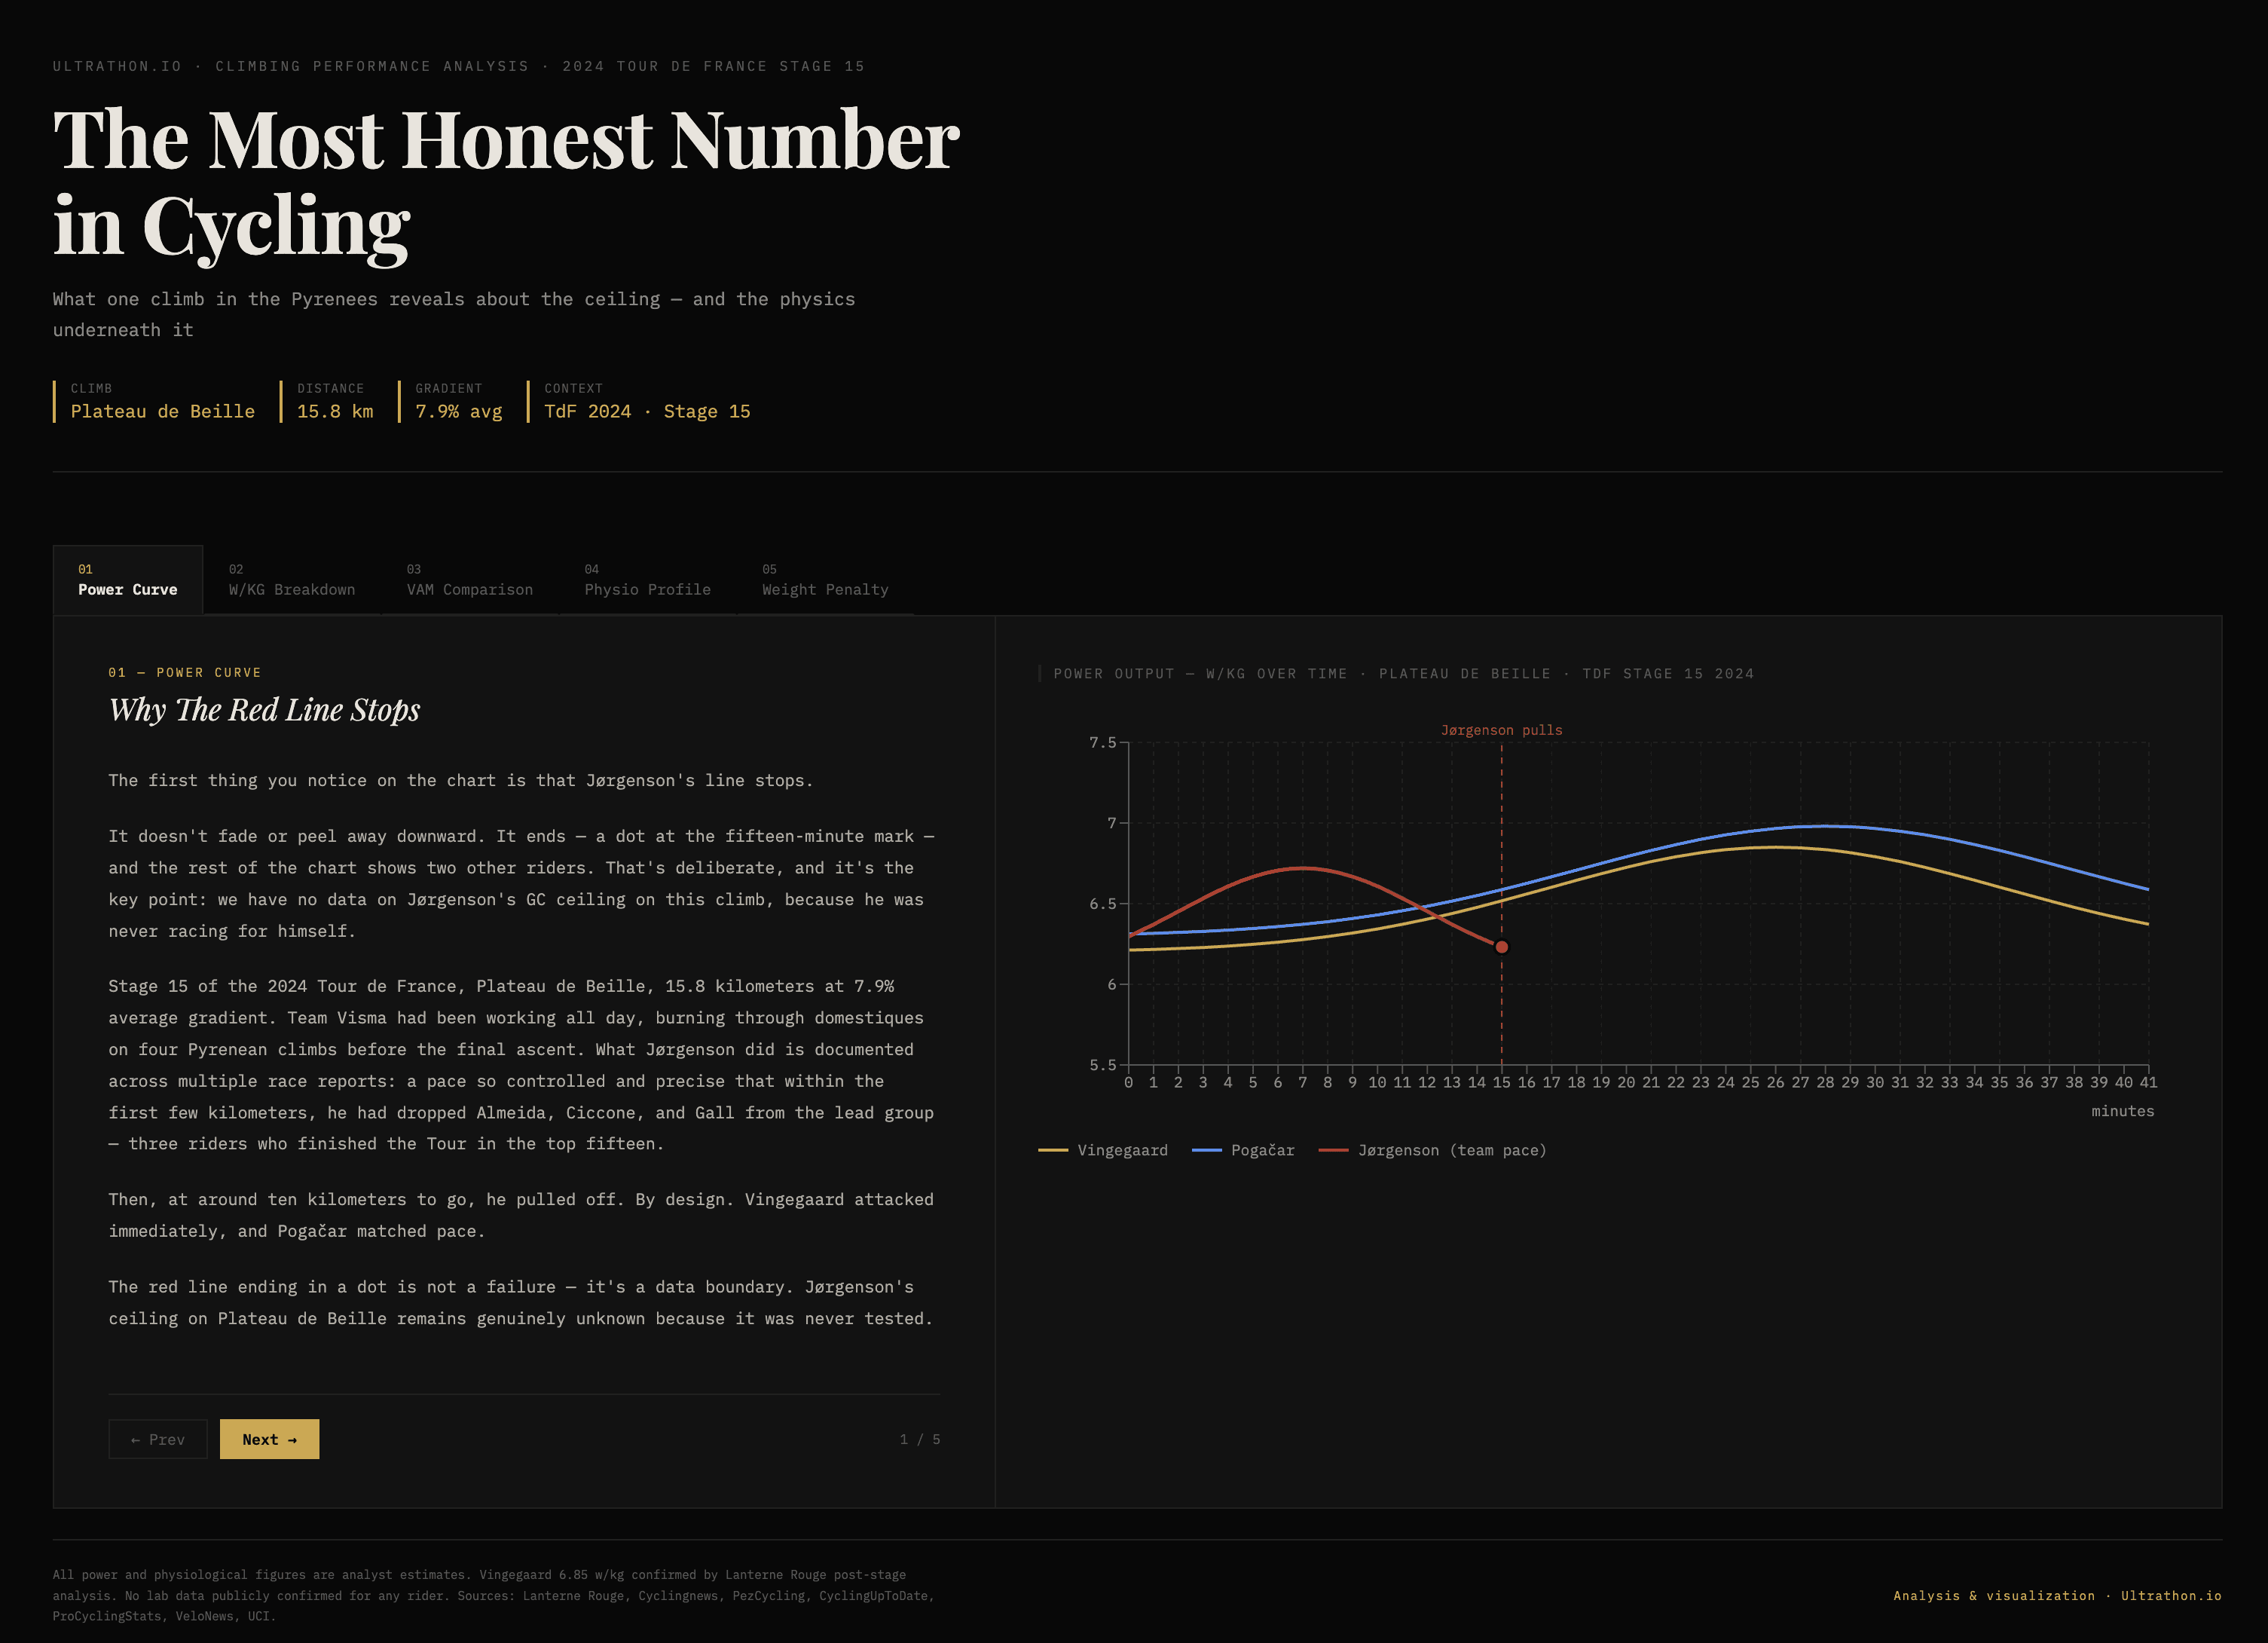
The Most Honest Number in Cycling
Stage 15 of the 2024 Tour de France produced two of the greatest climbing performances ever recorded. It also produced a question that never got a clean answer.
Matteo Jørgenson spent the first fifteen minutes of Plateau de Beille doing something remarkable — riding a pace so controlled it dropped three top-fifteen finishers from the lead group — and then pulled aside, by design, and watched Jonas Vingegaard and Tadej Pogačar ride away. What followed was the obvious question: what was Jørgenson actually capable of on that climb, and how far was he from the riders he was working for?
This dashboard is an attempt to answer it honestly, tab by tab.
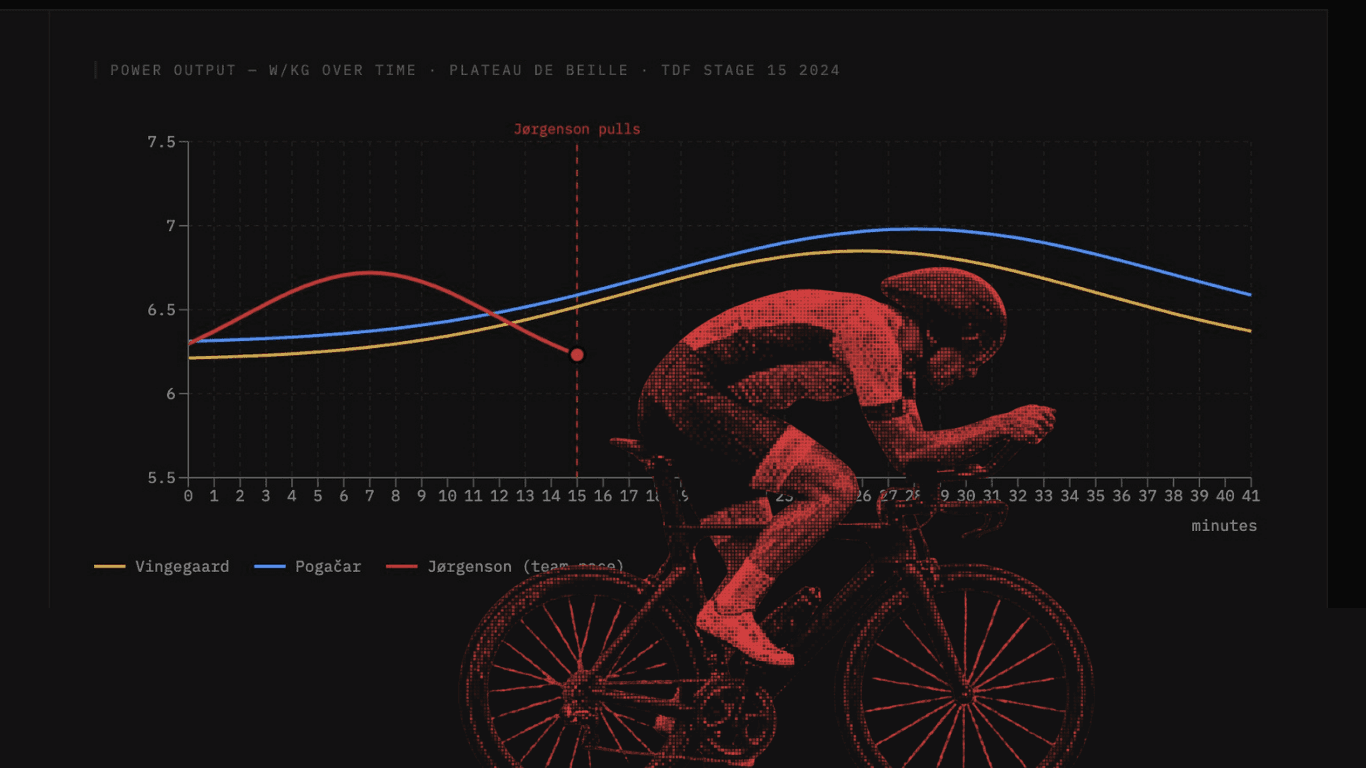
Tab 1 — Power Curve
Establishes the data boundary. Jørgenson's line ends at minute fifteen as a dot, not a fade. His GC ceiling on Beille is genuinely unknown because it was never tested. The chart belongs to Vingegaard and Pogačar from that point forward.
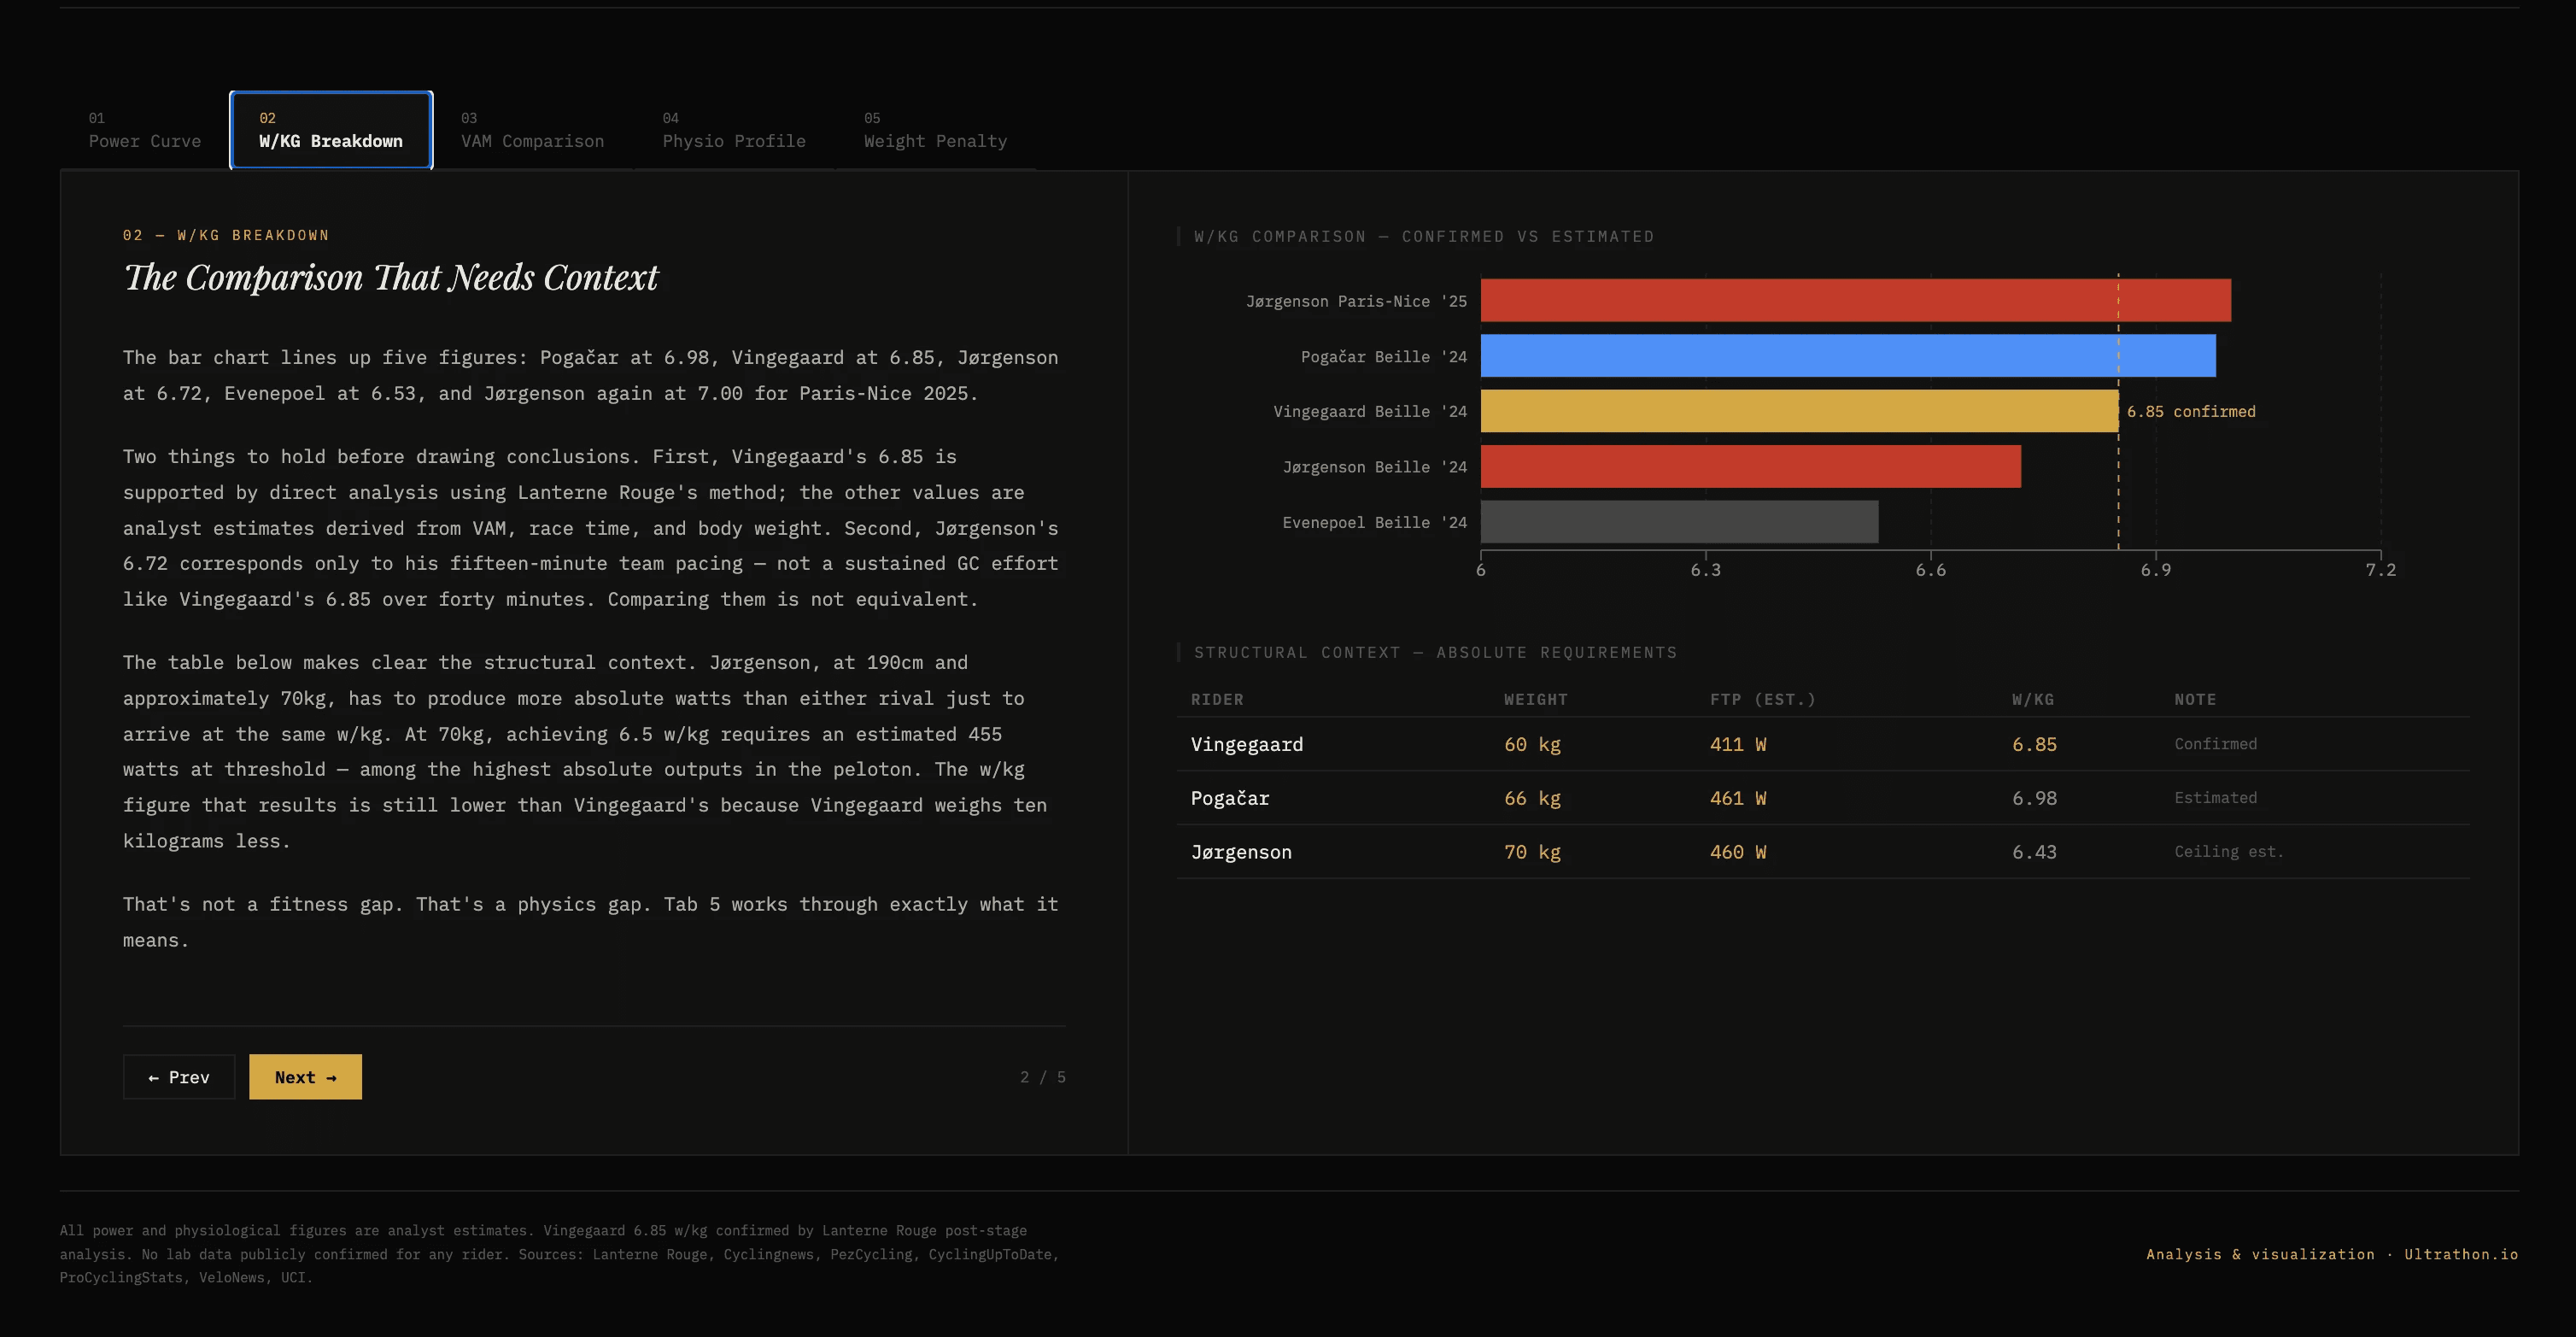
Tab 2 — W/KG Breakdown
Contextualizes the numbers before comparing them. Vingegaard's 6.85 is confirmed. The others are analyst estimates. And Jørgenson's 6.72 reflects a fifteen-minute team effort — not the same physiological demand as a forty-minute GC race.
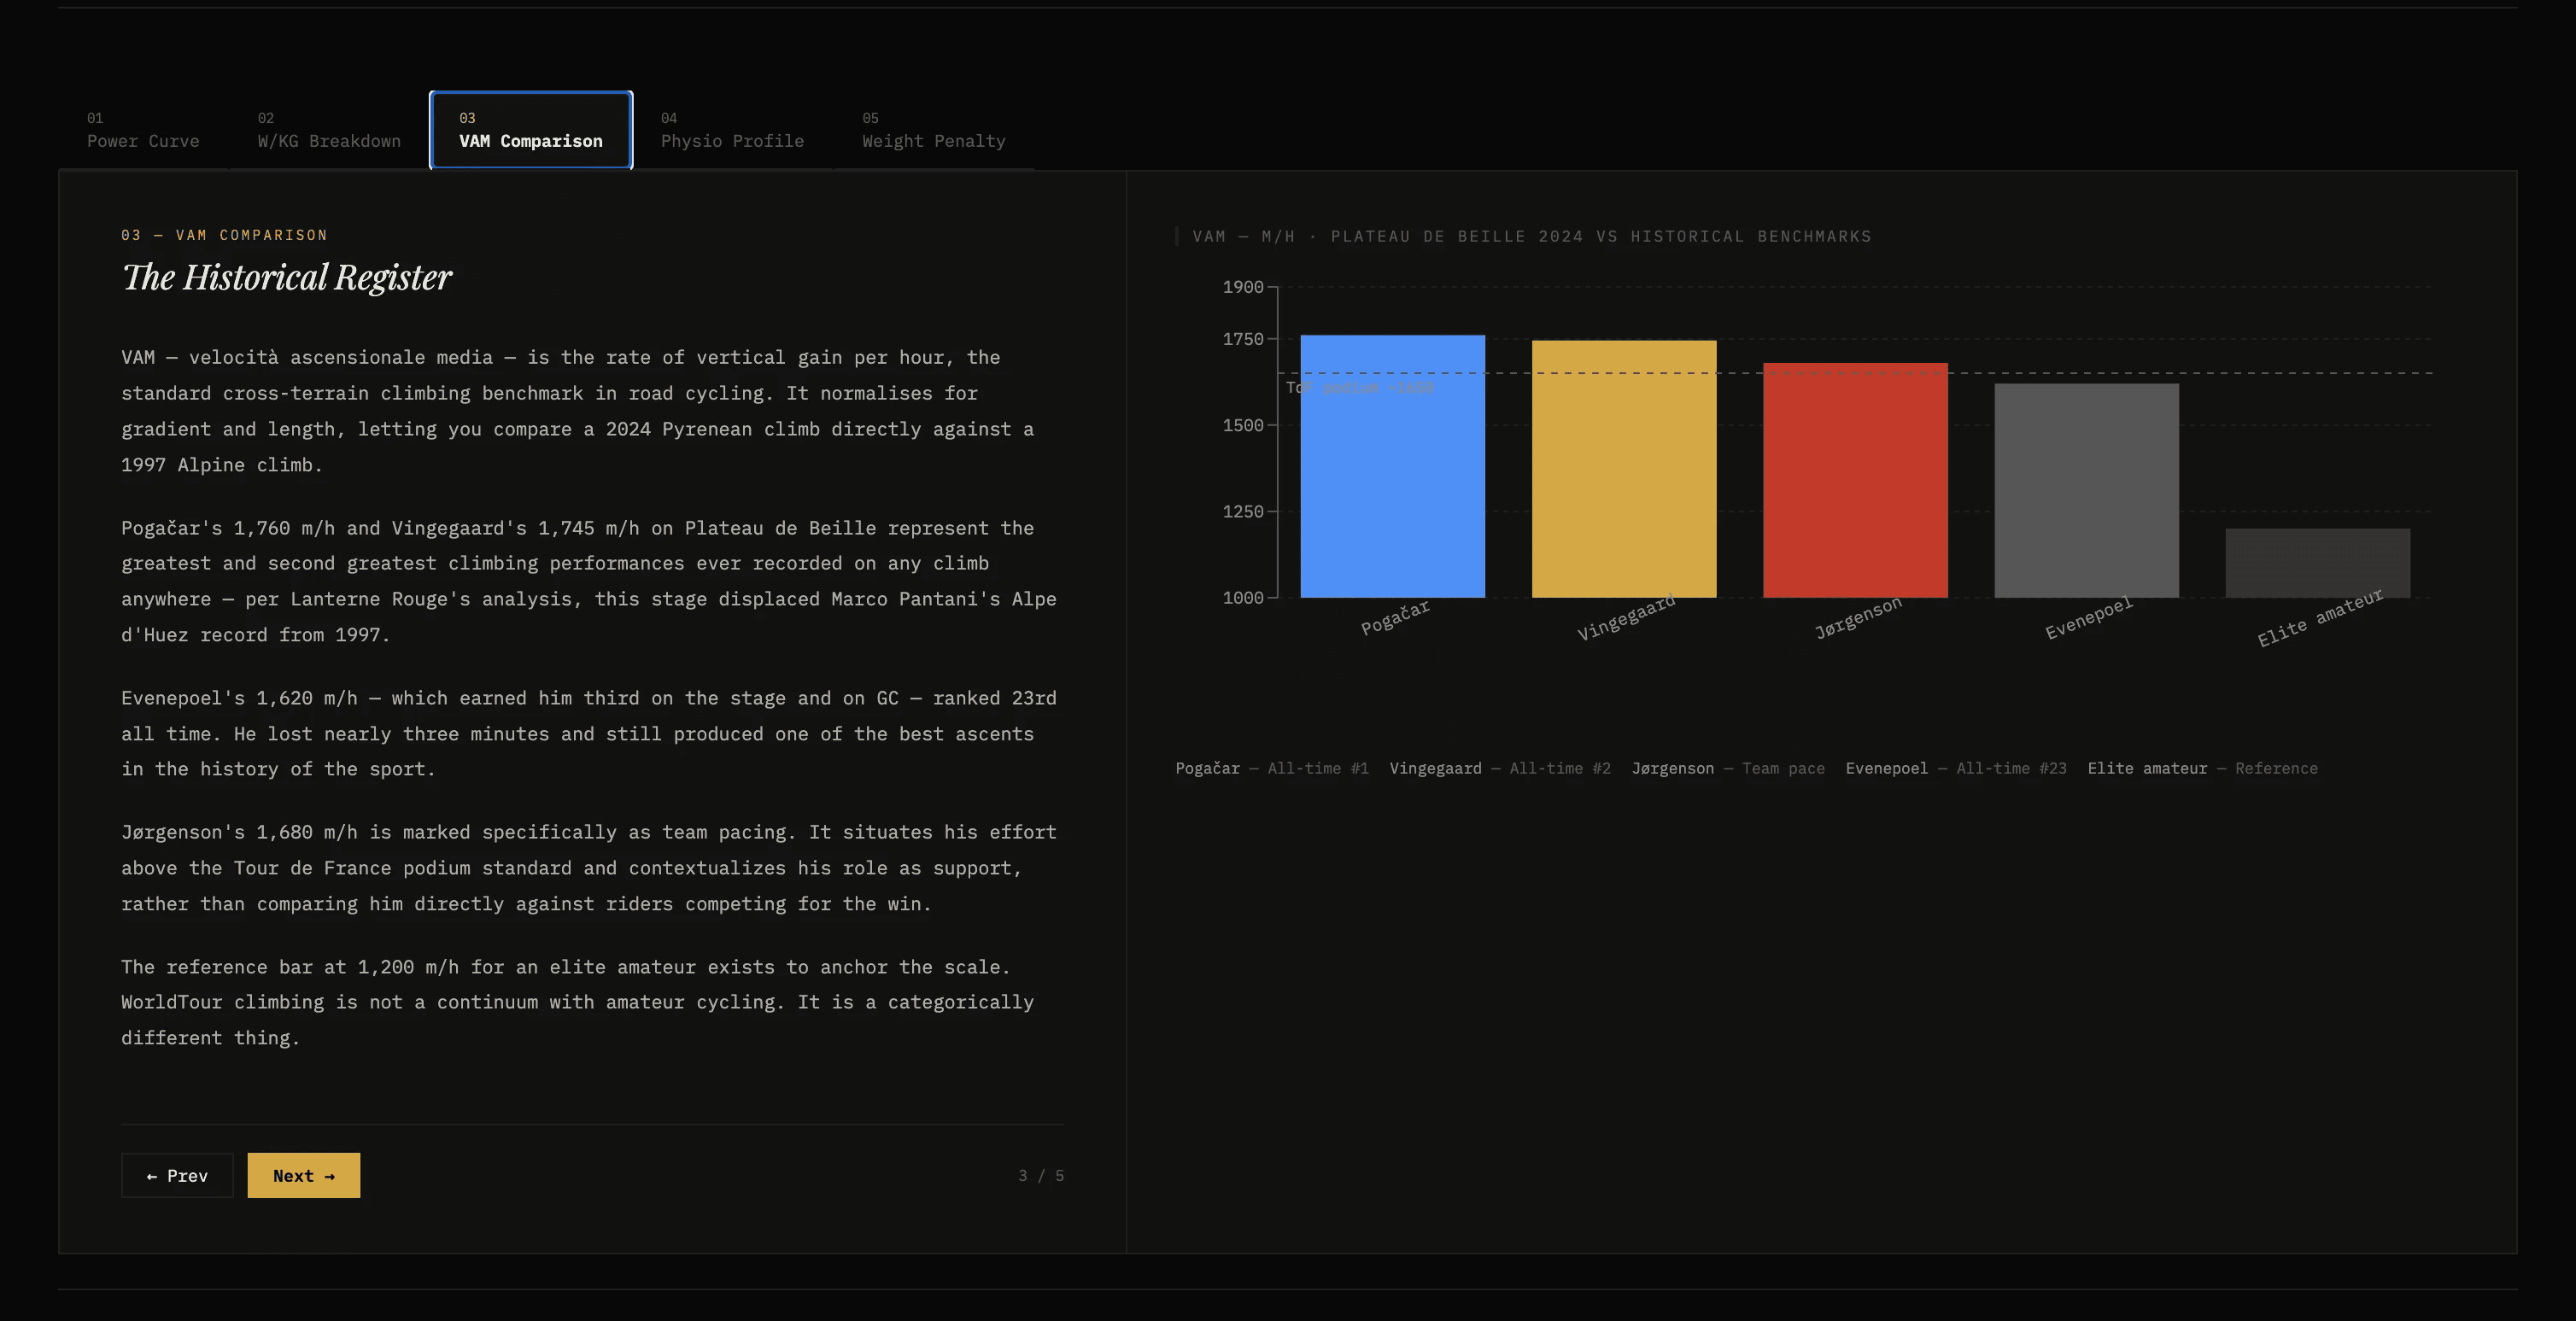
Tab 3 — VAM Comparison
Places Beille in the historical record. Pogačar's 1,760 m/h and Vingegaard's 1,745 m/h displaced Pantani's Alpe d'Huez from the all-time list. Evenepoel's 1,620 m/h — good for 23rd all time — lost him nearly three minutes.
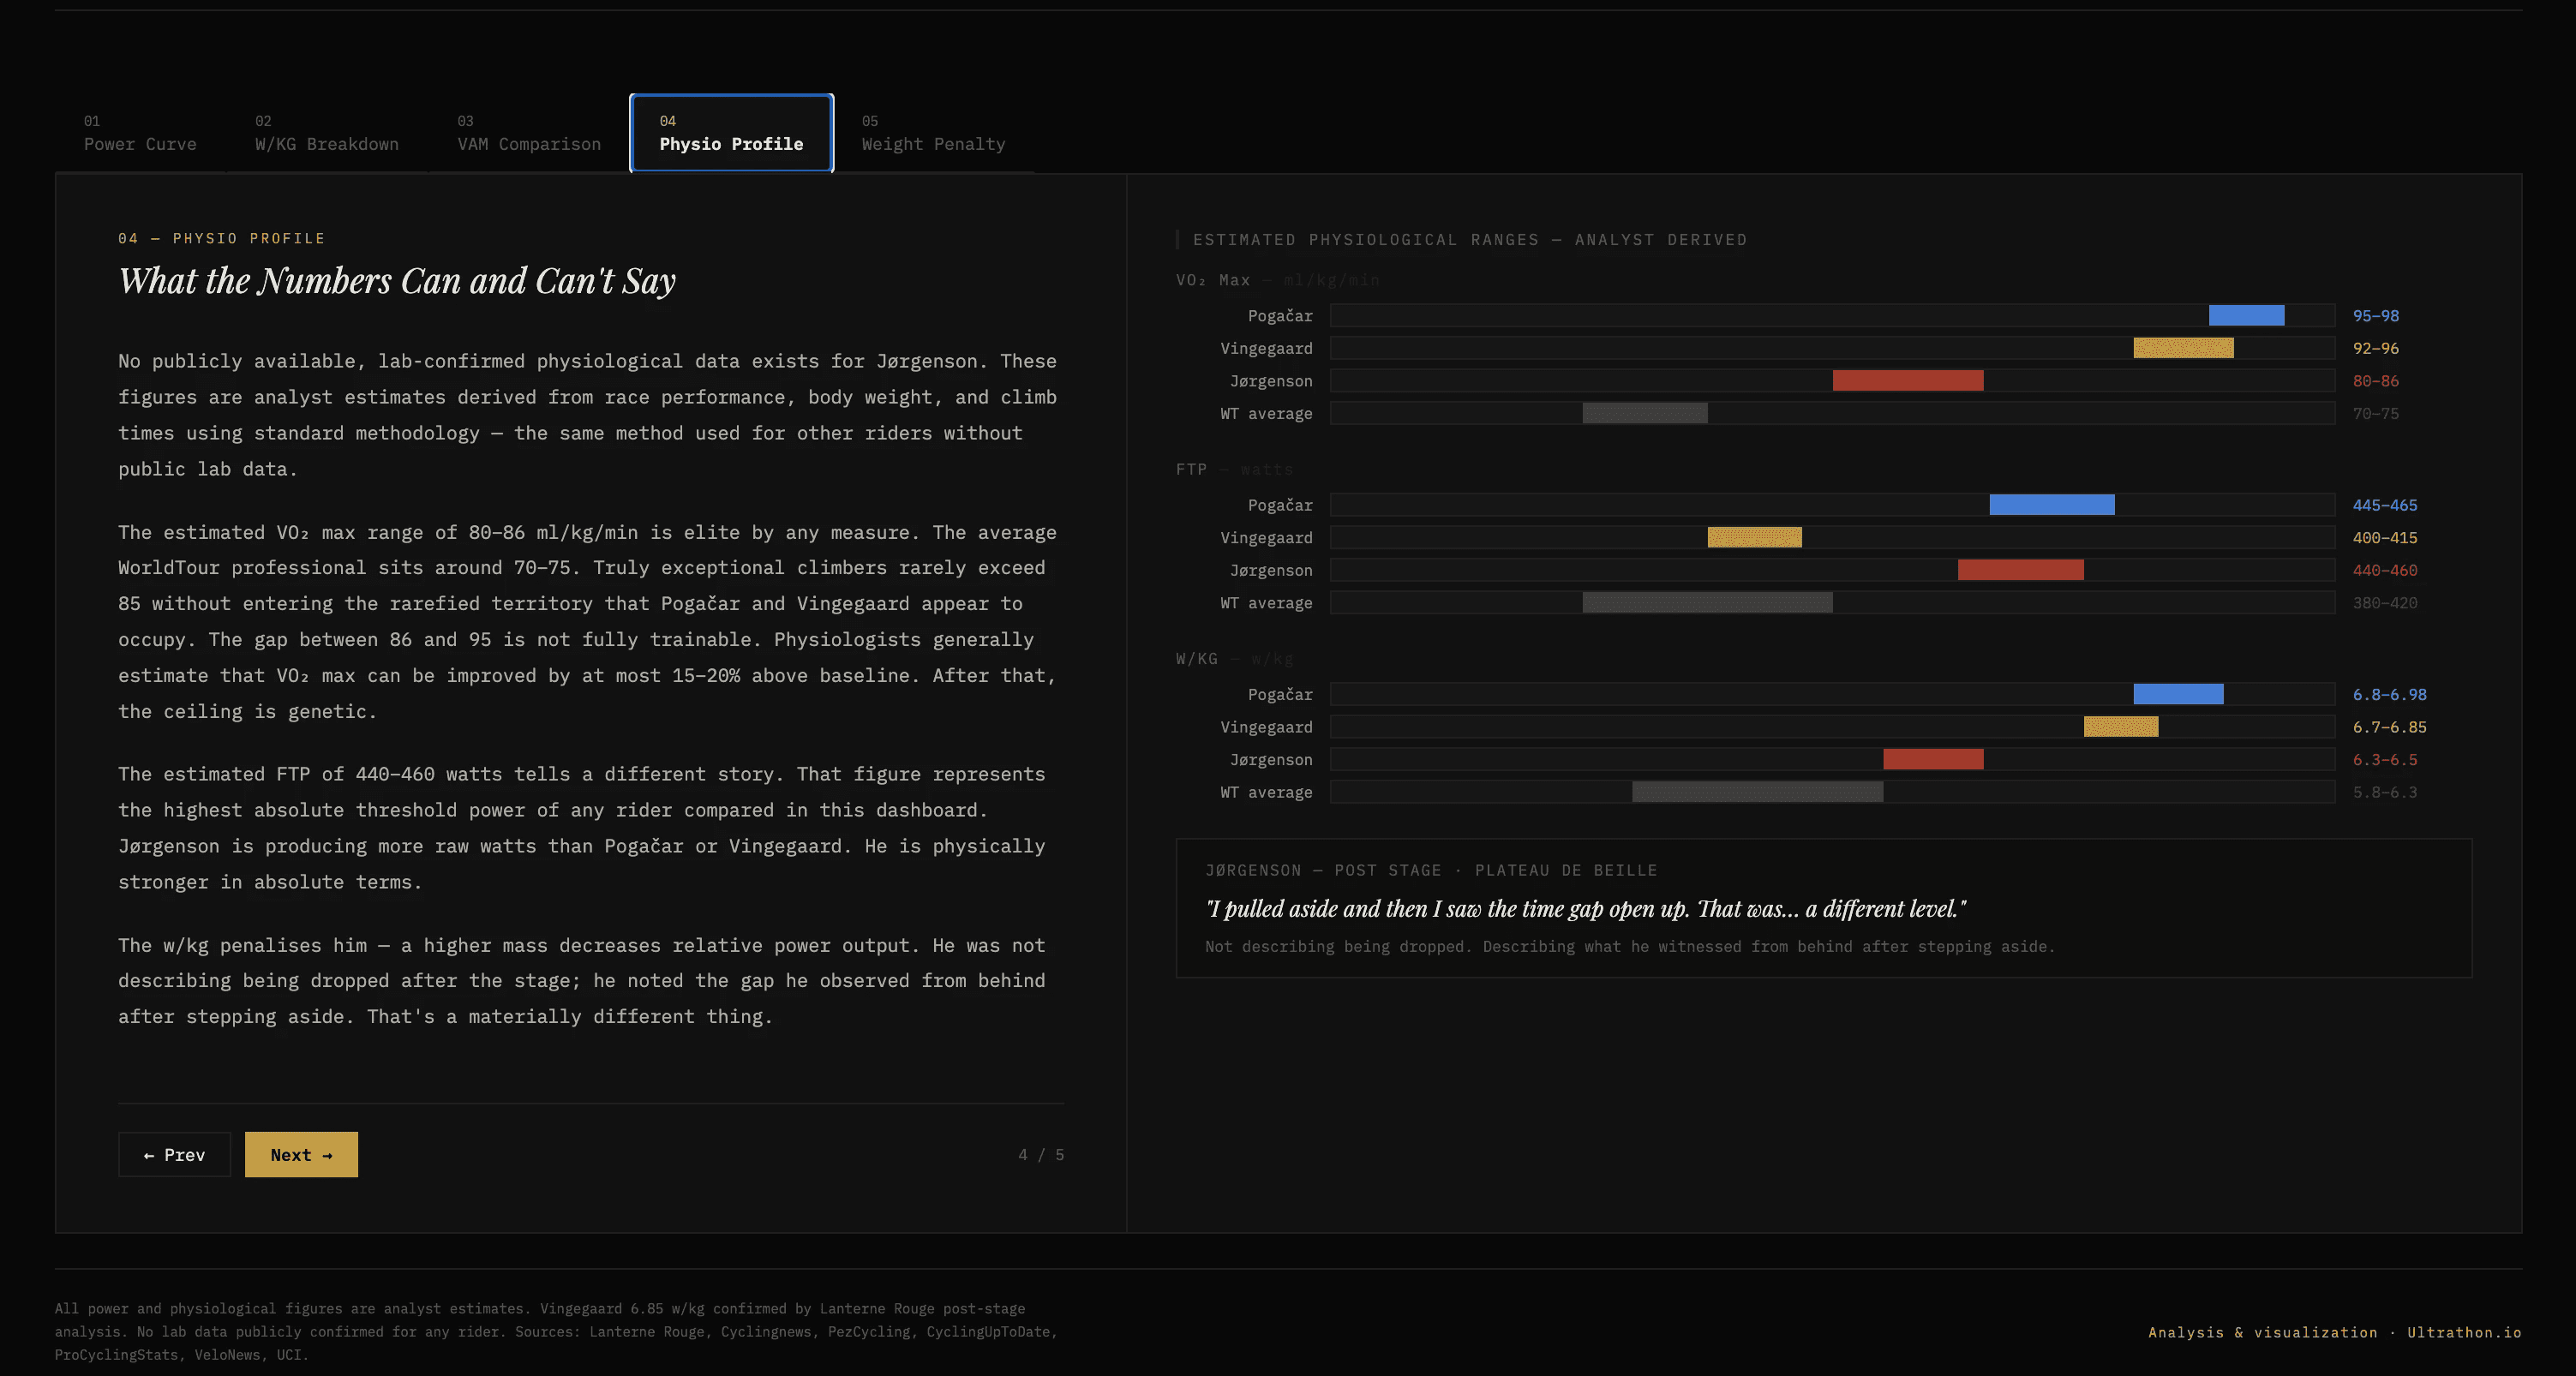
Tab 4 — Physio Profile
Draws the ceiling. Jørgenson's estimated FTP of 440–460 watts is the highest absolute output in the comparison. His VO₂ max ceiling is not. The gap above 86 is not primarily trainable.
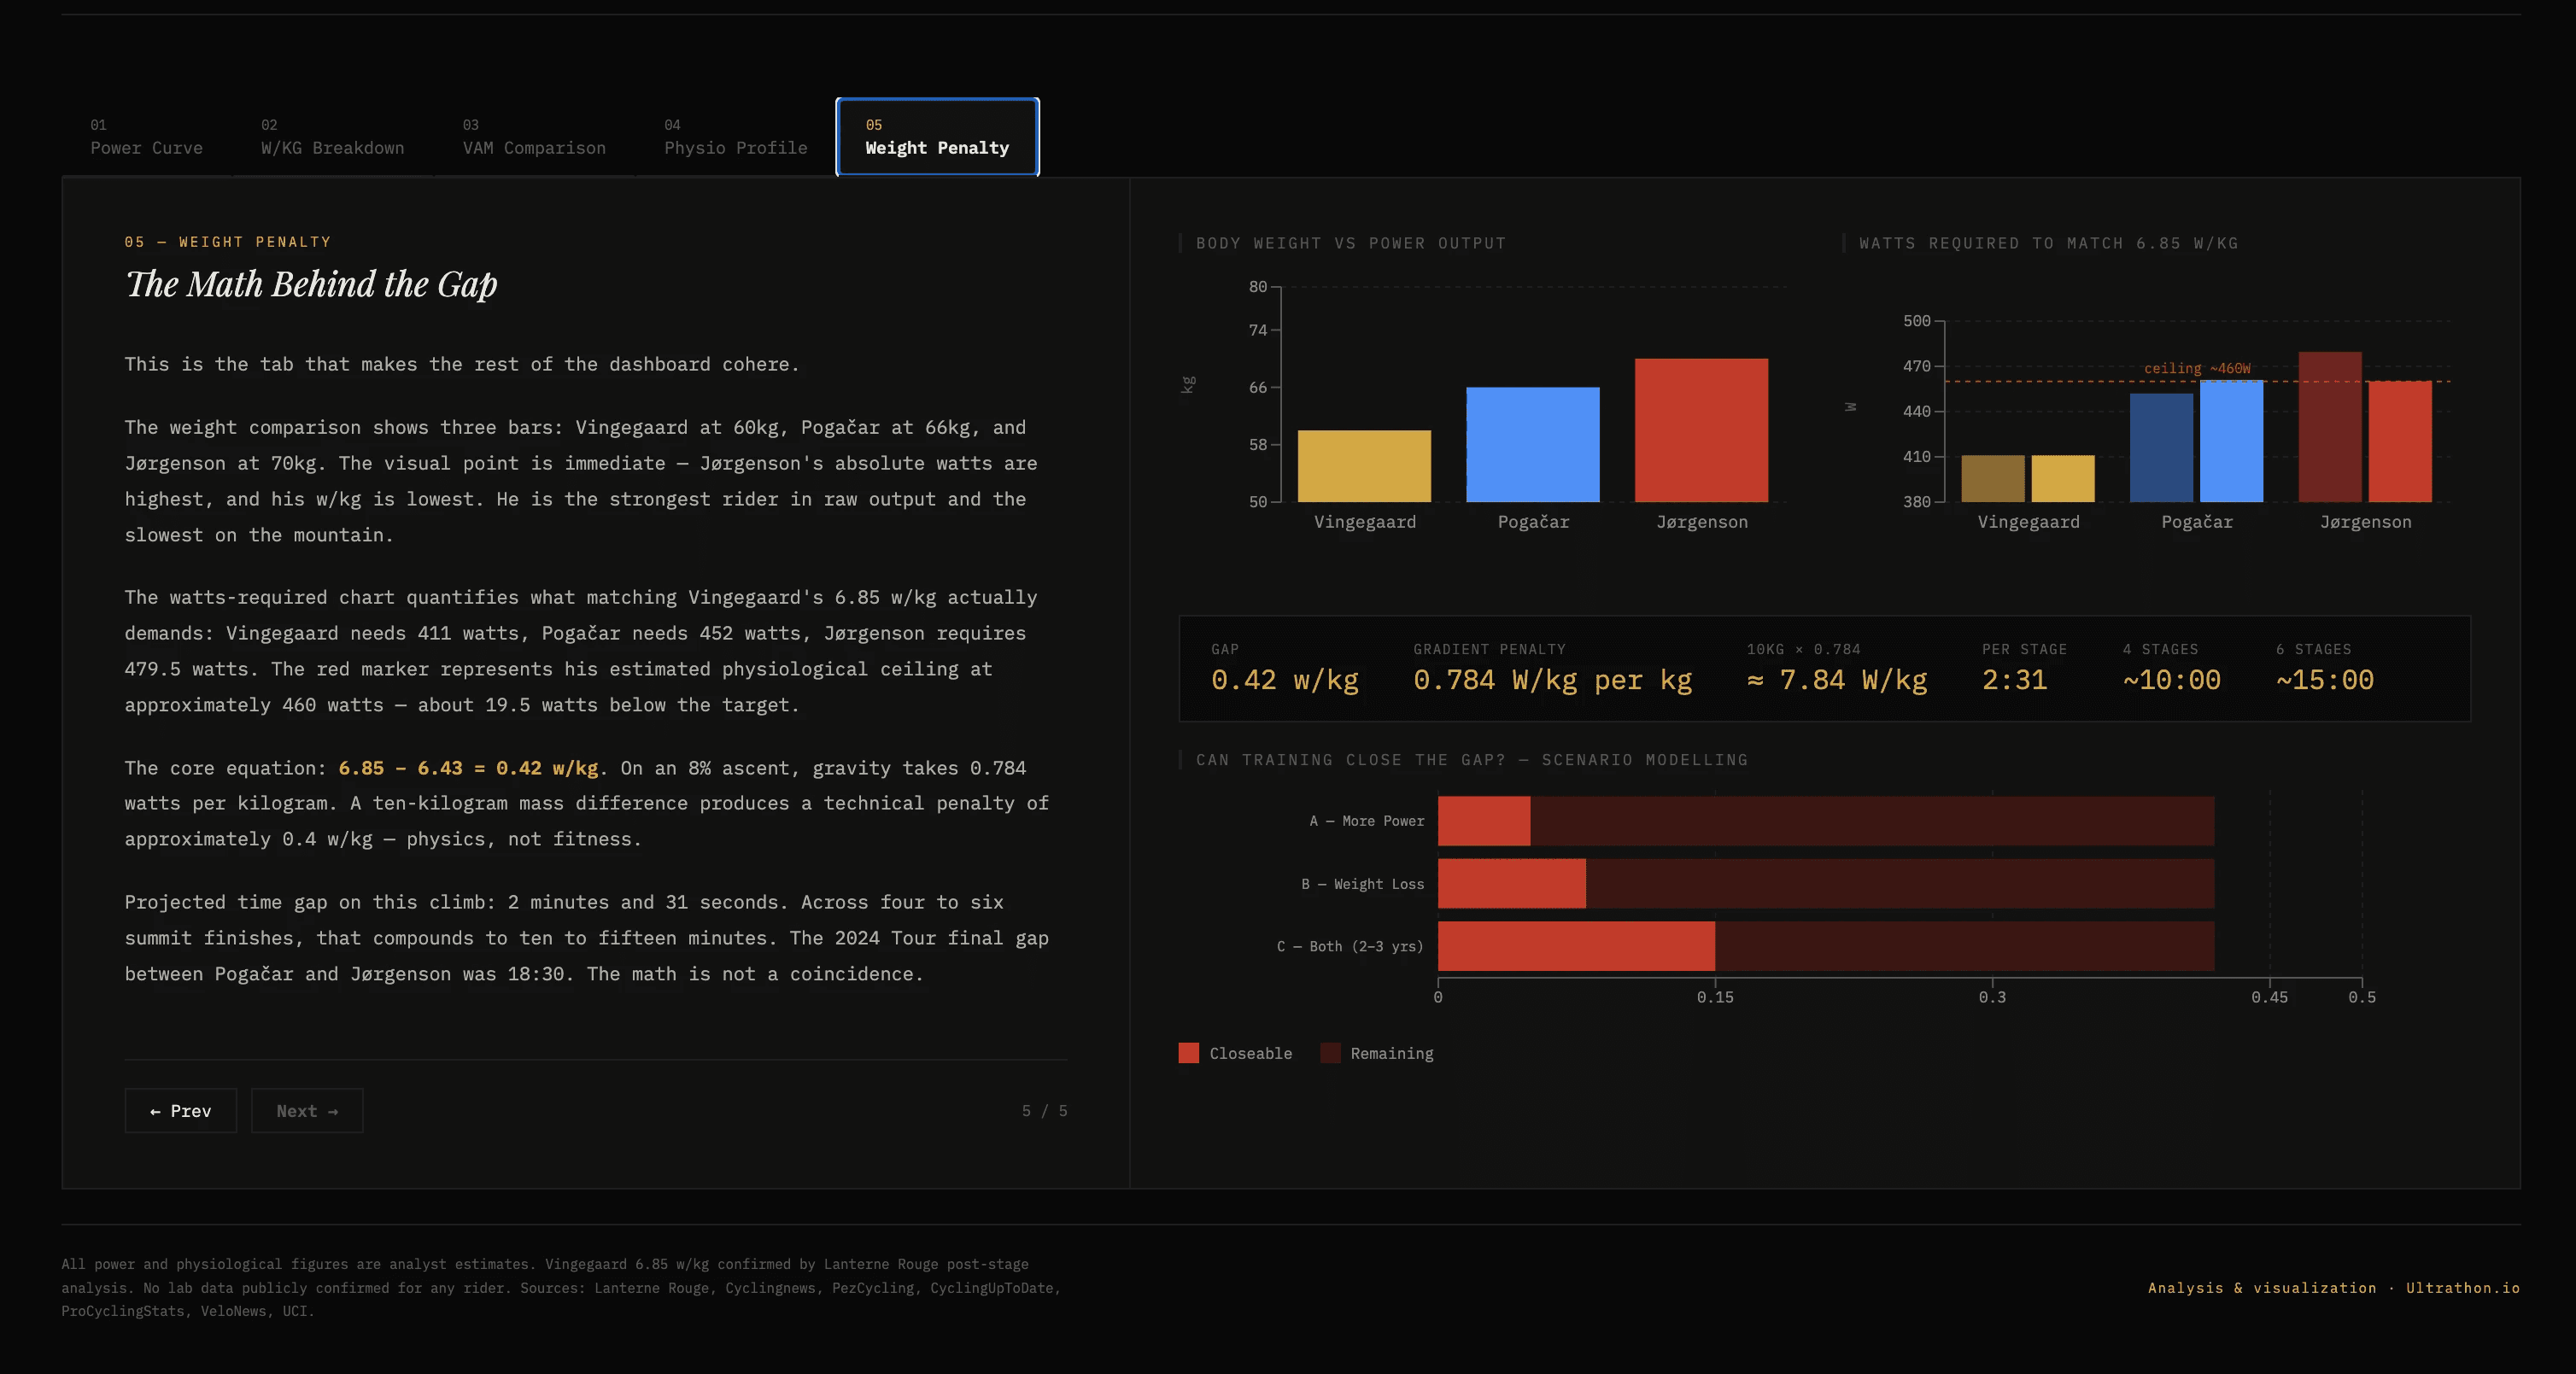
Tab 5 — Weight Penalty
Closes the argument. At 70kg versus Vingegaard's 60kg, the gradient physics produce a structural deficit of approximately 0.42 w/kg — roughly 2:31 per summit finish, compounding to ten to fifteen minutes across a Grand Tour. The 2024 Tour final gap between Pogačar and Jørgenson was 18:30. The math is not a coincidence.
year
2026
timeframe
4 days
tools
React 18, Recharts, CSS, Claude Code
category
Personal Project