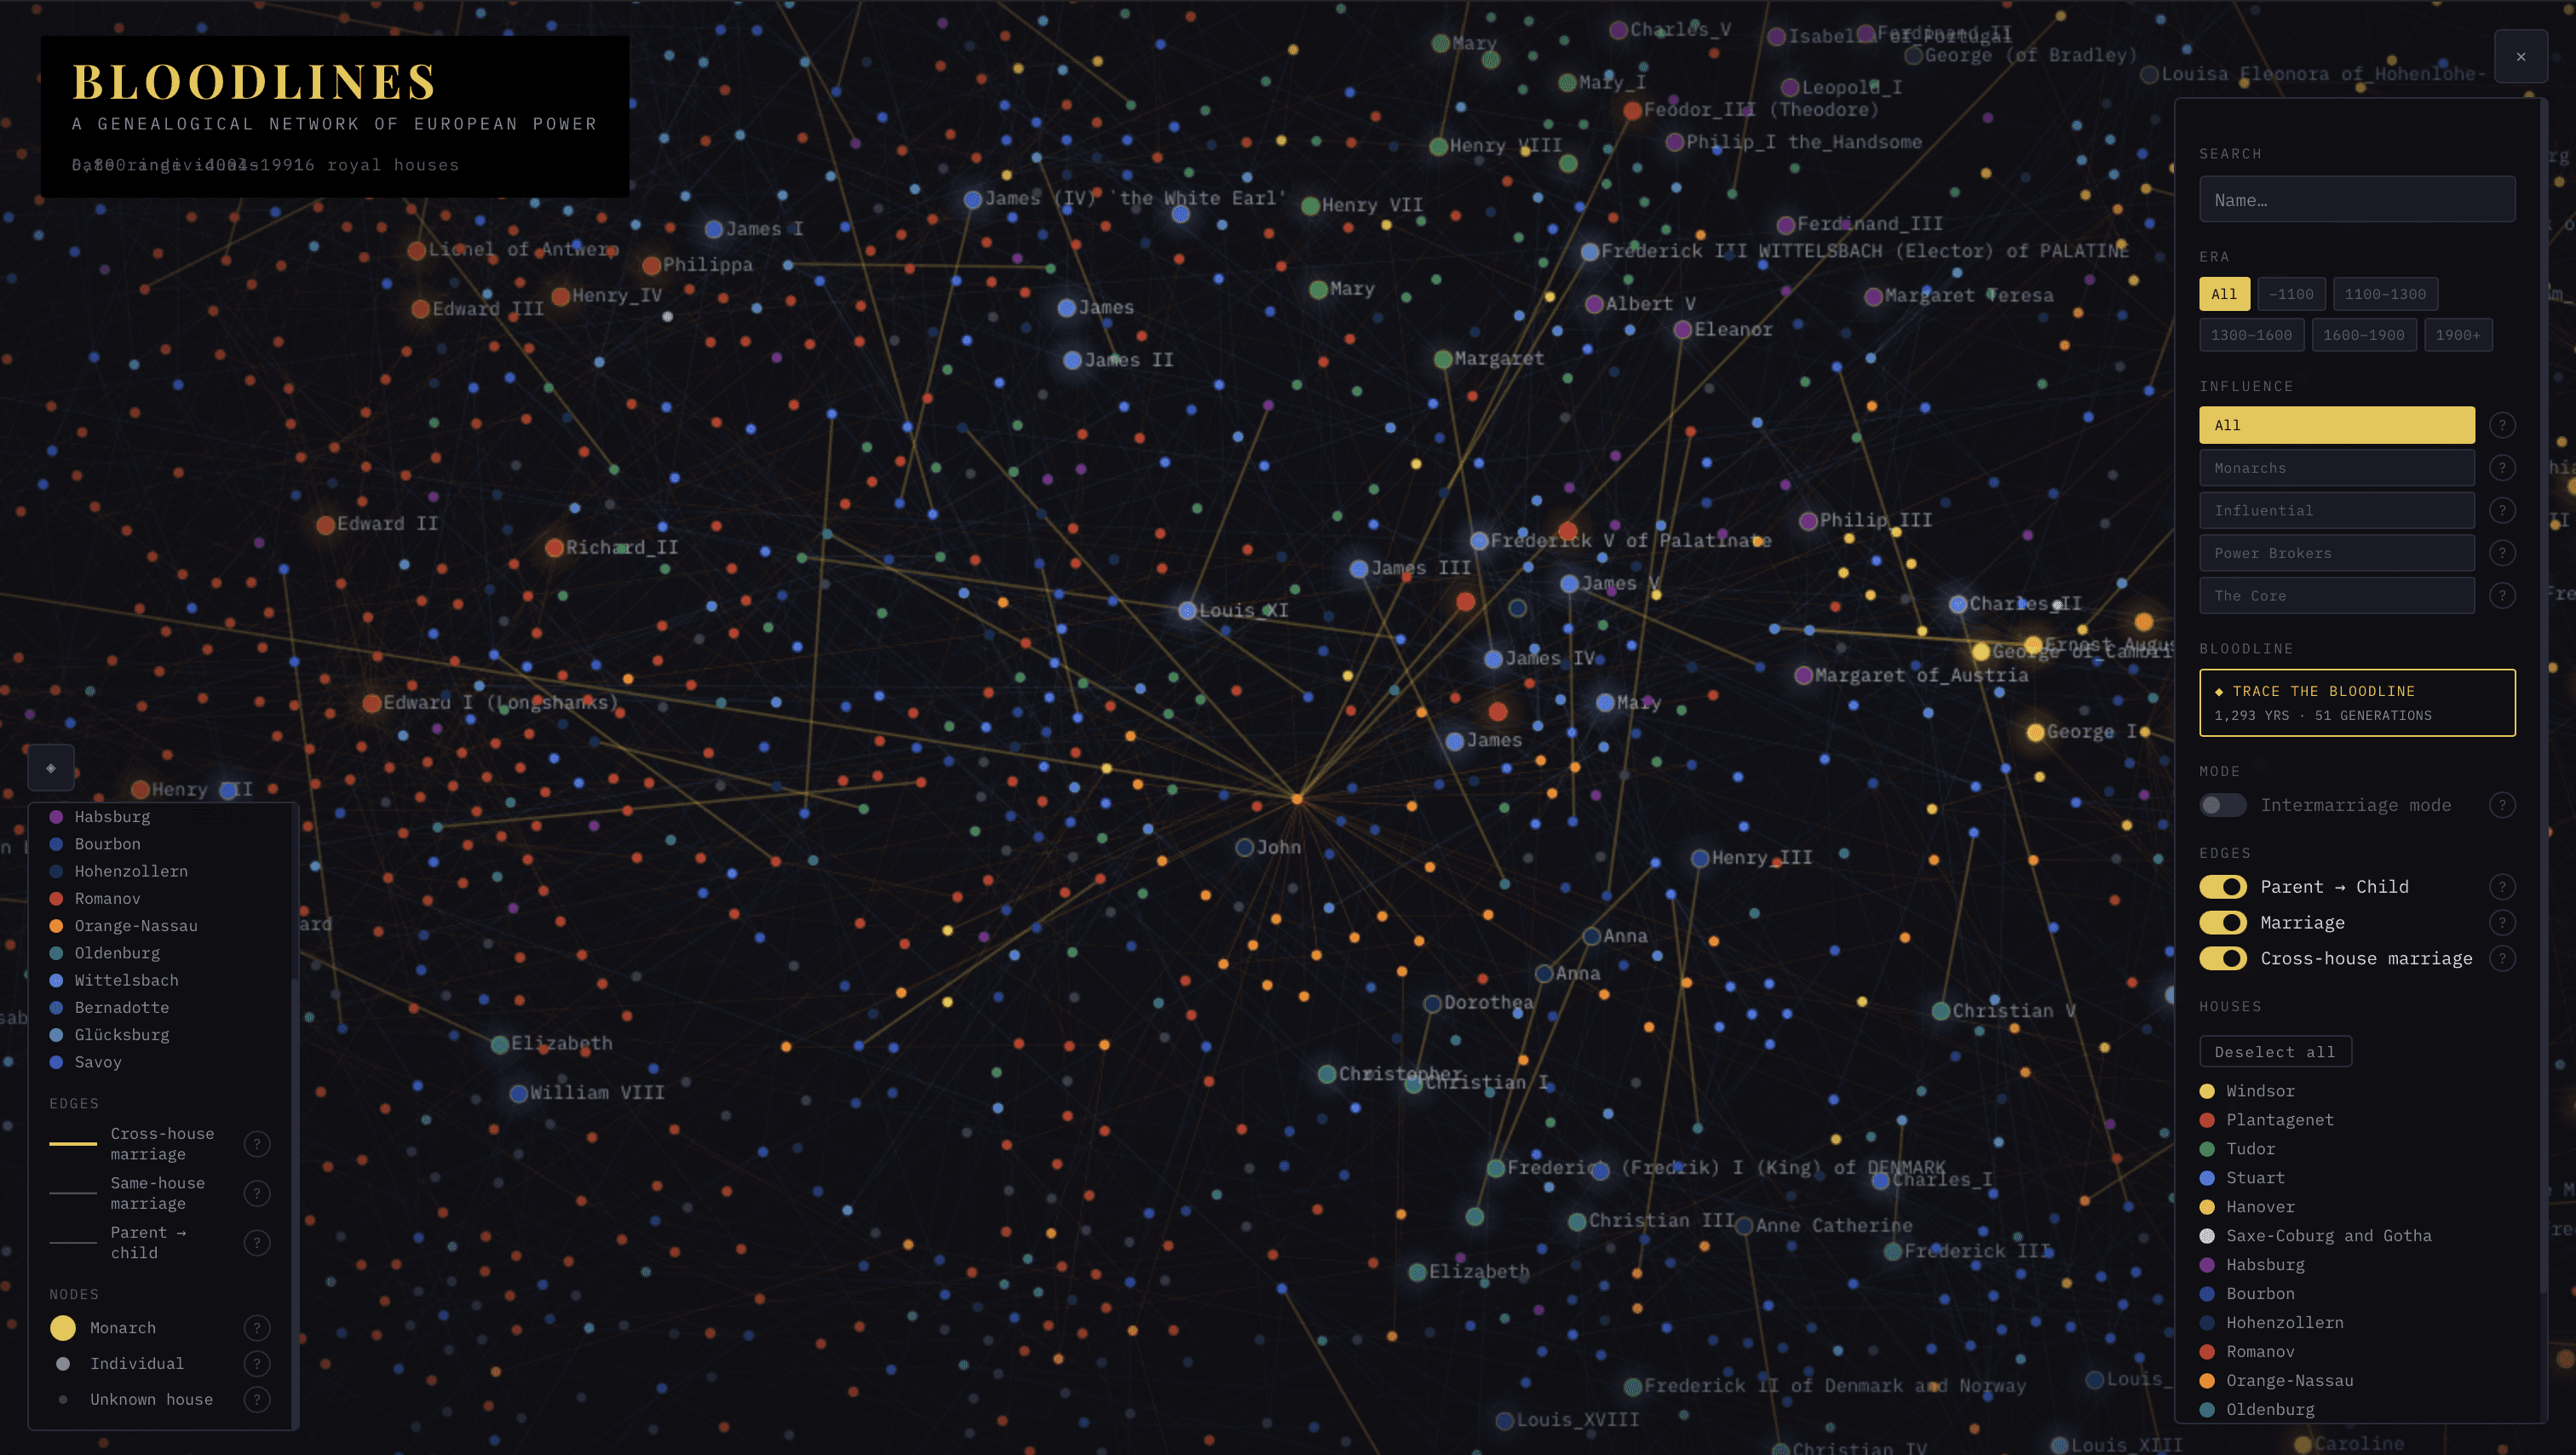
bloodlines
A Genealogical Network of European Power. BLOODLINES is an interactive force-directed network graph rendering thousands of individuals and 1,200+ years of European royal genealogy in an explorable visualization.
00
problem
European monarchies have never been independent. From Alfred the Great in 849 AD to the present House of Windsor, the thrones of England, Scotland, France, Spain, Germany, Russia, Denmark, Norway, Sweden, Belgium, the Netherlands, Greece, and Romania have been occupied by members of an interconnected web of bloodlines — linked through centuries of strategic marriage, succession, and alliance.
solution
The data is public. As far as I'm aware, no one has visualized the full picture. BLOODLINES takes the exapansive web, spun from the strategic use of intermarriage and alliance, and makes it explorable.
The Question
What does it look like when a continent's worth of political power flows through one family — for twelve centuries?
European monarchies have never been independent. From Alfred the Great in 849 AD to the present House of Windsor, the thrones of England, Scotland, France, Spain, Germany, Russia, Denmark, Norway, Sweden, Belgium, the Netherlands, Greece, and Romania have been occupied by members of an interconnected web of bloodlines — linked through centuries of strategic marriage, succession, and alliance.
The data is public. No one has visualized the full picture.
The Project
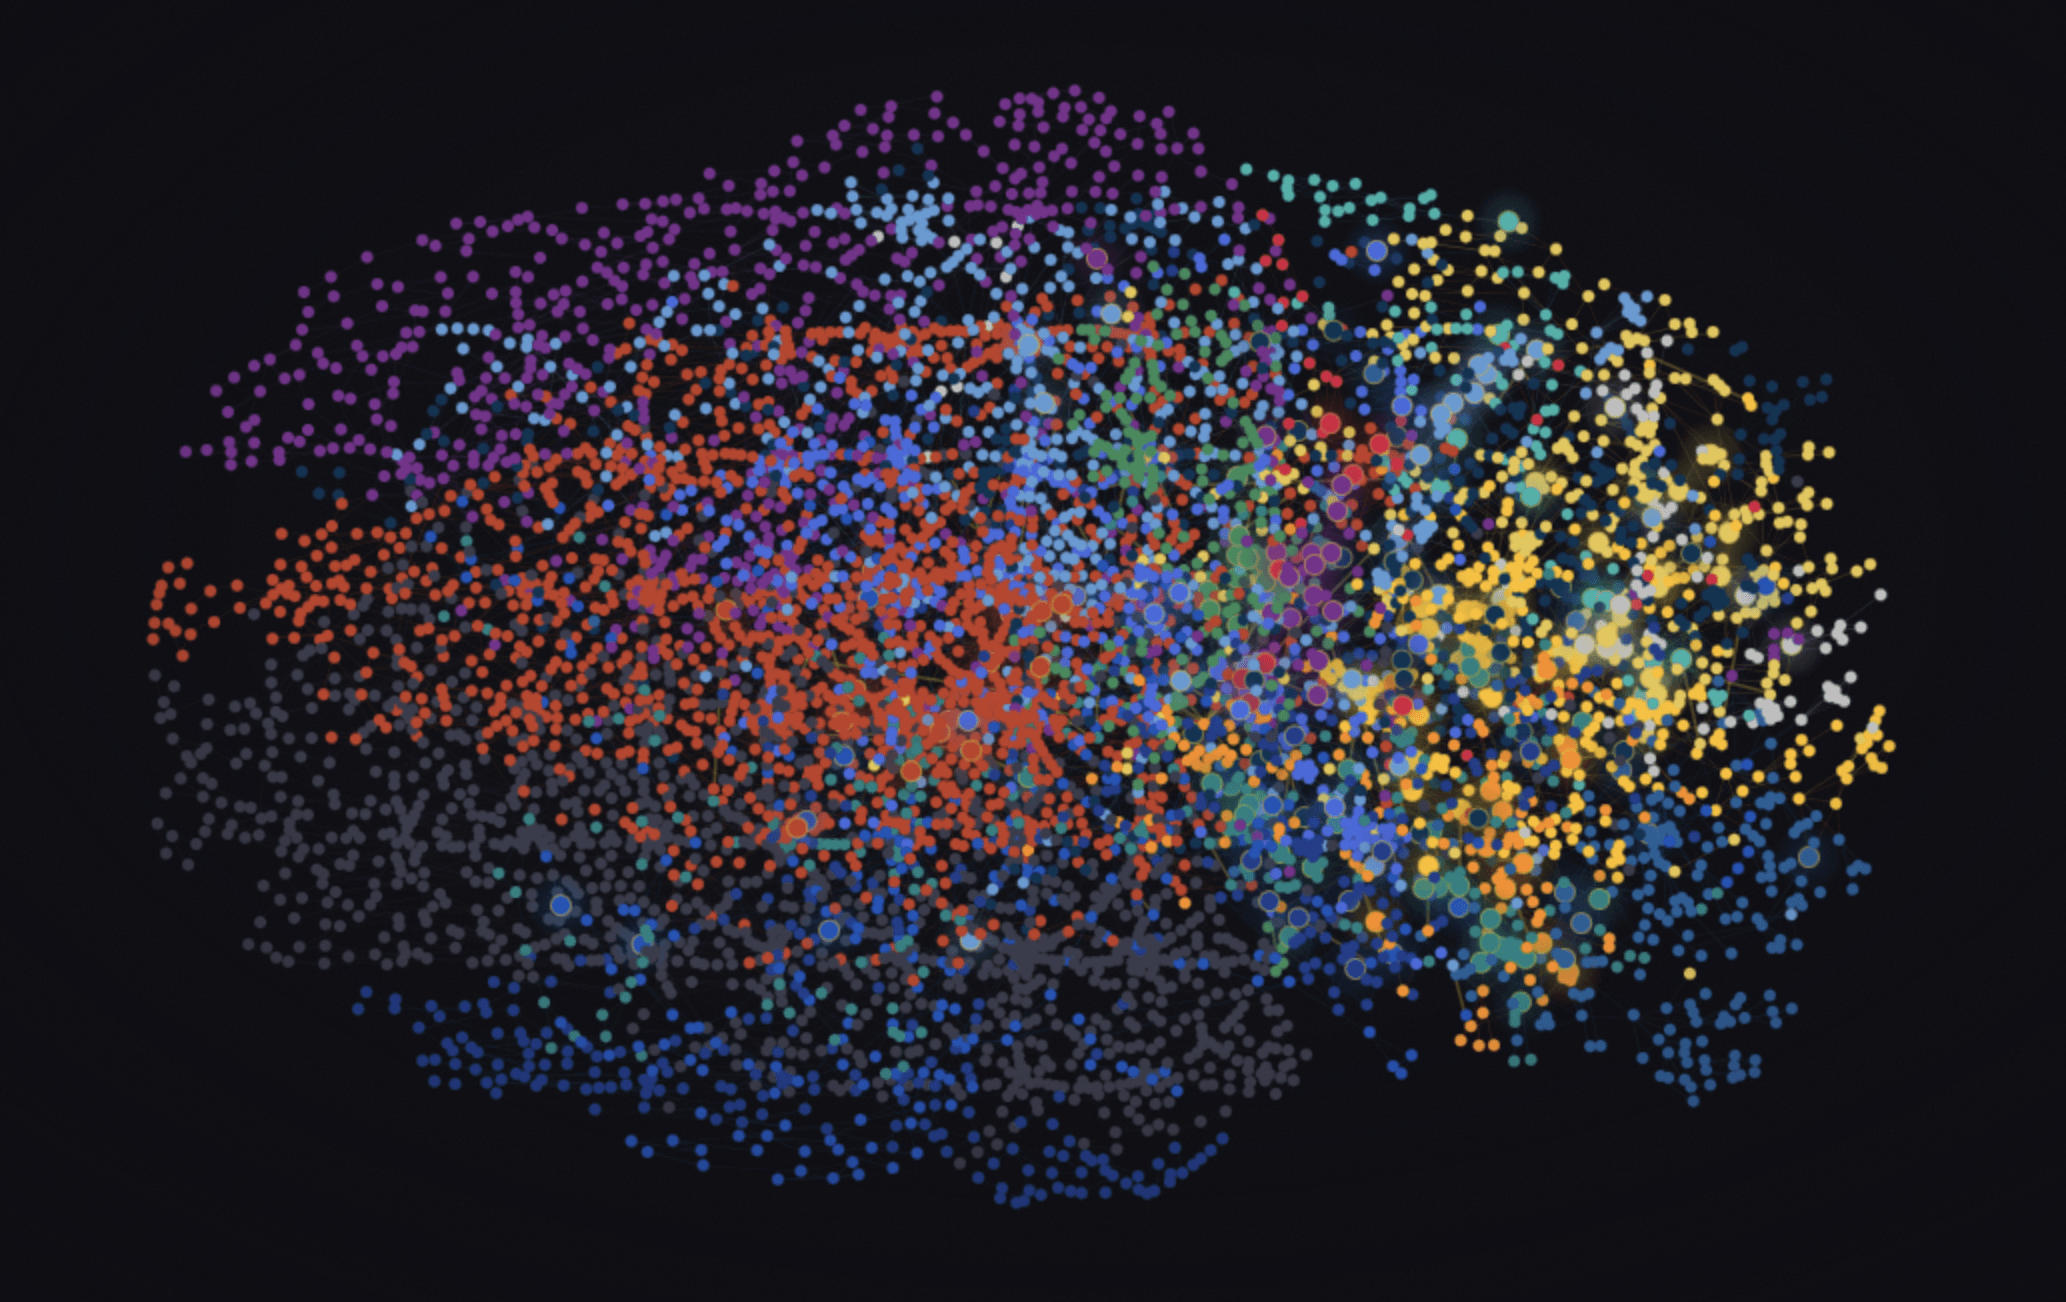
BLOODLINES is an interactive force-directed network graph rendering 1,200+ years of European royal genealogy. Thousands of individuals as nodes, color-coded by royal house. Tens of thousands of edges — blood connections in house colors, cross-house marriages in gold.
The density is the argument.
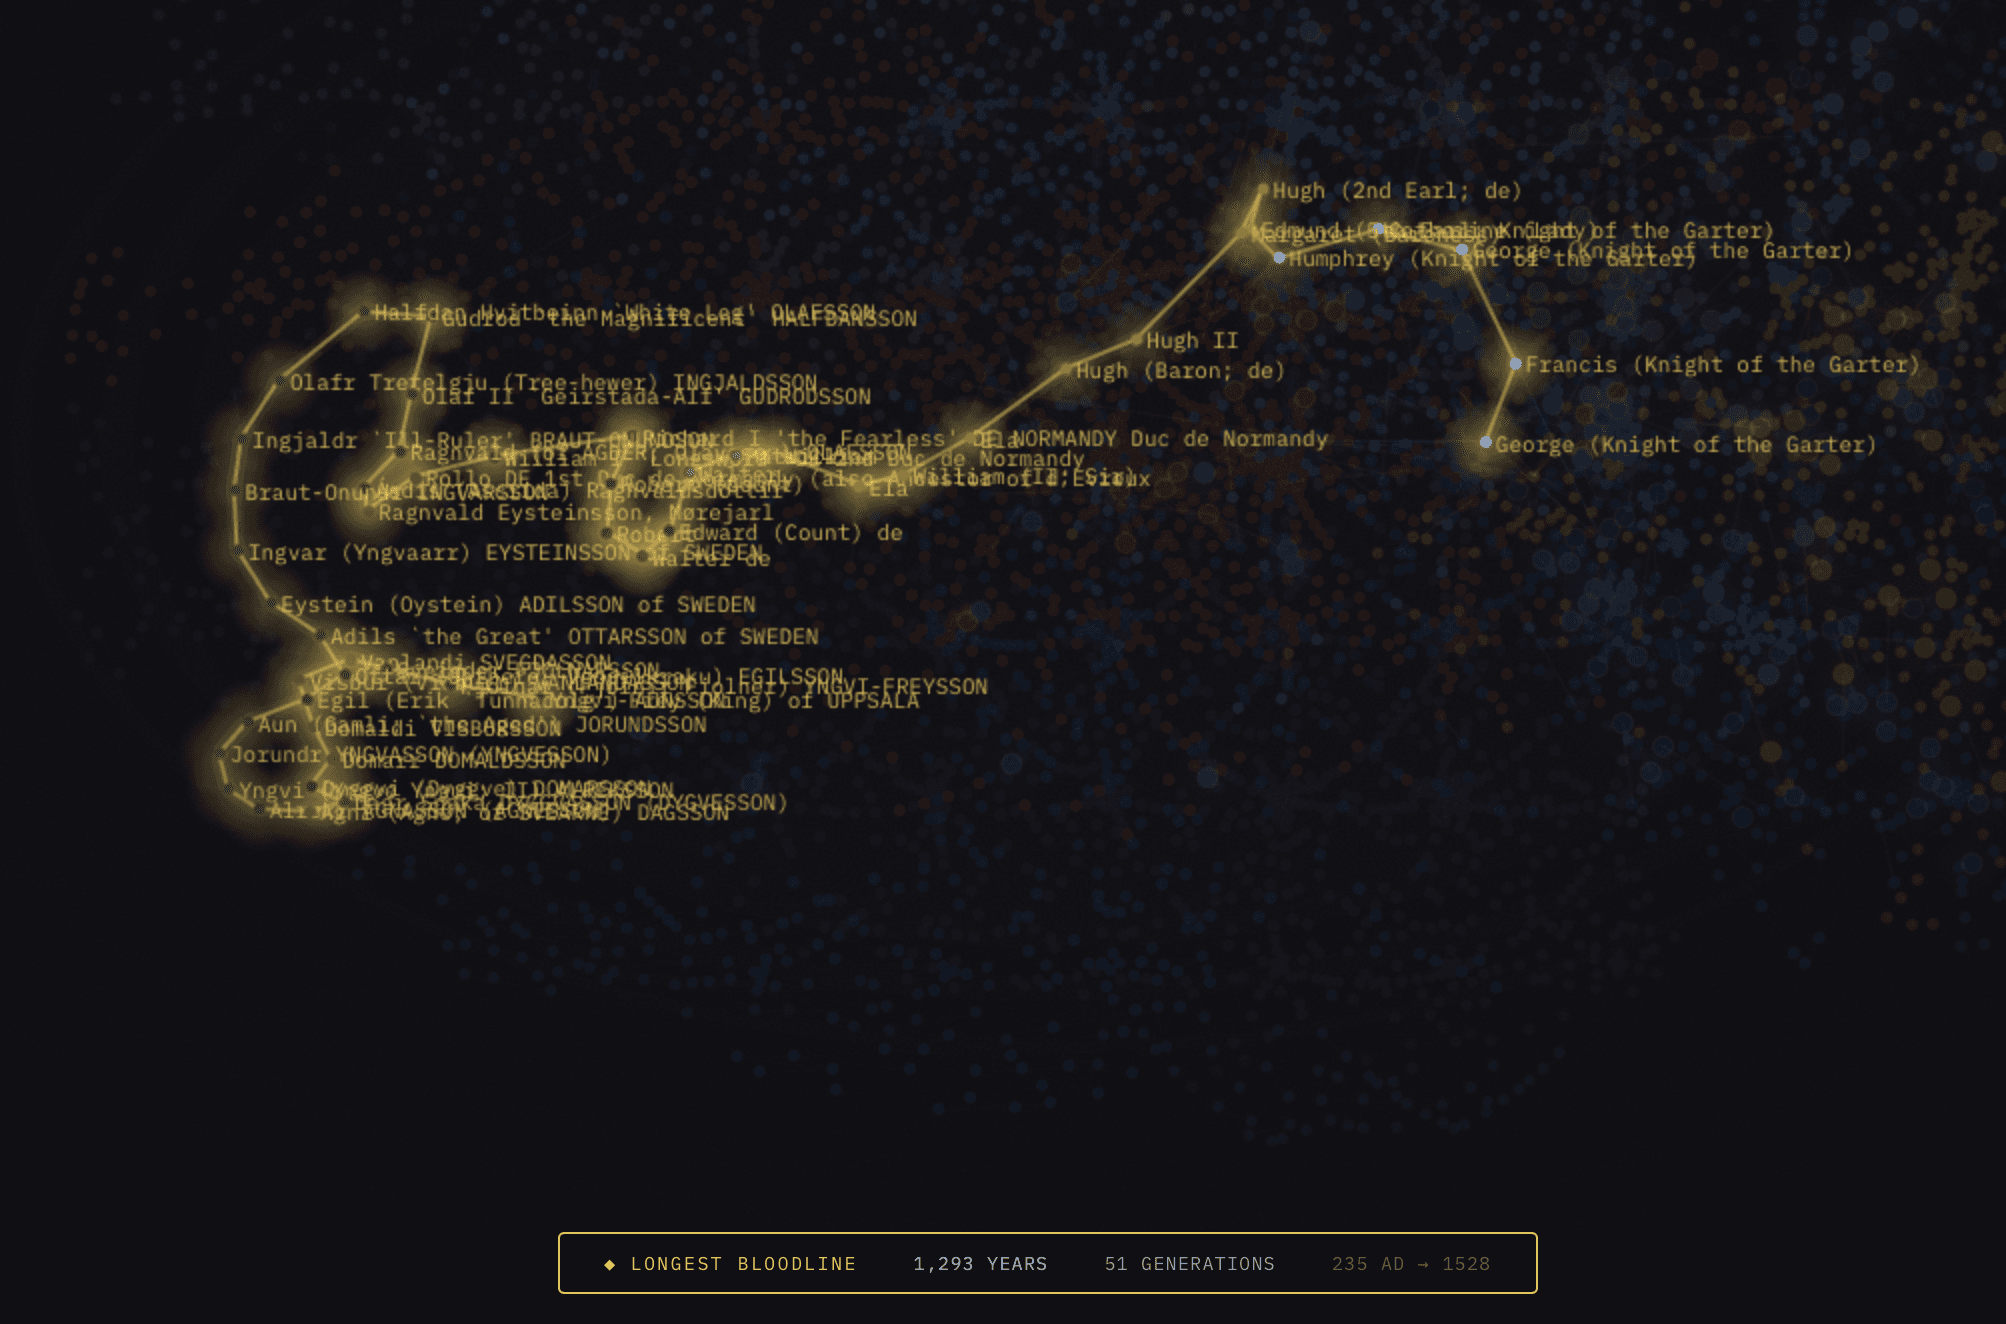
When you zoom out, the graph doesn't look like a family tree. It looks like an org chart—or a galaxy of stars. Gold marriage lines connect every major cluster. The same surnames appear on multiple thrones simultaneously. Victoria's grandchildren ruled eight countries at once. Charles III has 222 million ancestor slots across 60 generations — but only 3,910 unique individuals. That's a 99.99% overlap.
The visualization presents these facts without commentary. The viewer connects the dots — literally.
Methodology
Data pipeline:
Two publicly available GEDCOM genealogical datasets (4,500+ individuals from KingsCoronation.com, plus the canonical Royal92.ged European royalty file) were parsed, merged, and deduplicated. The merged dataset was enriched via SPARQL queries against Wikidata for structured metadata — royal house affiliations, titles held, reign dates, and territorial control.
Computed metrics:
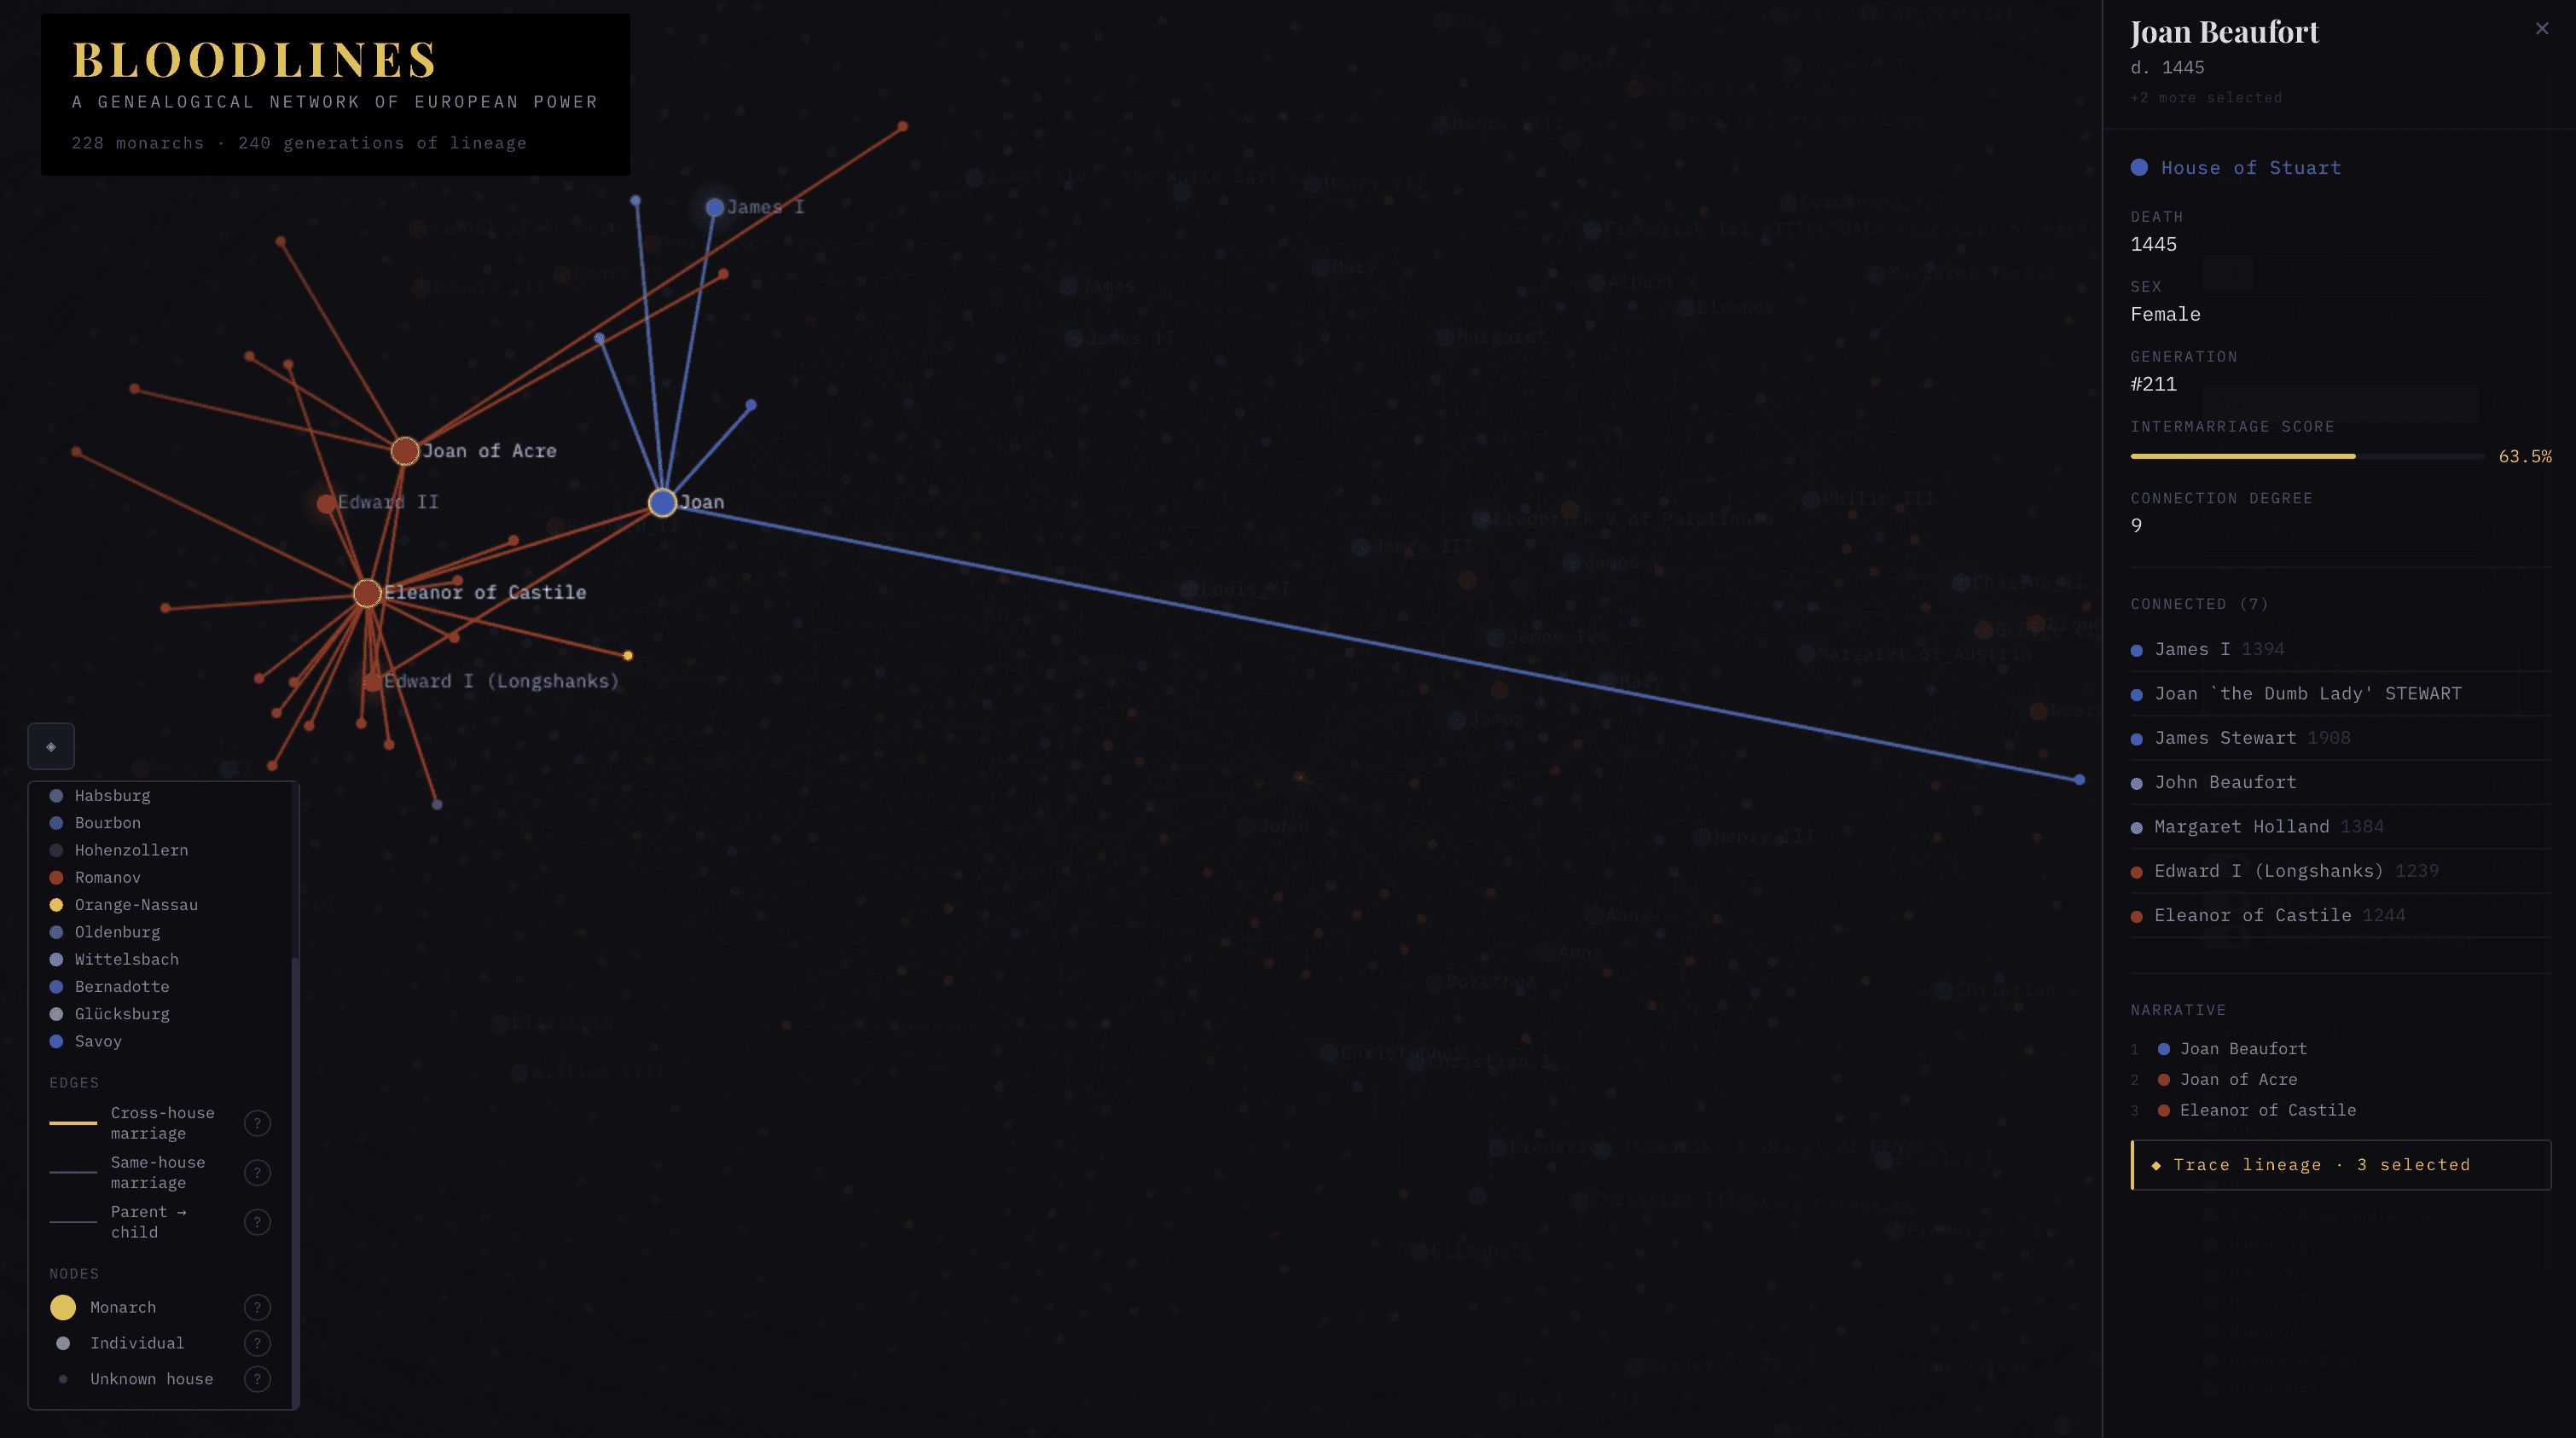
Each individual receives an intermarriage score (how many ancestors appear multiple times in their pedigree), a connection degree (total blood + marriage links), and a simultaneous-thrones count (how many related monarchs ruled concurrently). These derived fields drive the visual encoding — node size, glow intensity, and the emphasis logic of "Intermarriage Mode."
Visualization:
D3.js force-directed simulation rendered on HTML Canvas (SVG cannot handle this node count). Temporal bias on the X-axis creates a chronological left-to-right flow. House affiliation biases the Y-axis, creating visible clusters. Cross-house marriage edges — rendered in gold — emerge as the dominant structural pattern when parent-child edges are dimmed.
Technical Stack
React · Vite · D3.js (d3-force, d3-zoom, d3-quadtree) · Canvas API · Tailwind CSS · Wikidata SPARQL · GEDCOM parsing · Vercel
Design
Each royal house is assigned a heraldic jewel-tone color. The visual language is intelligence briefing — clinical, precise, and deliberately understated. No editorializing. Just the network, in full resolution, with the tools to explore it.
Features
Force-directed network graph with 4,000–7,000+ nodes rendered at interactive frame rates on Canvas
House color-coding across 15+ European royal dynasties (Windsor, Plantagenet, Tudor, Stuart, Hanover, Habsburg, Bourbon, Hohenzollern, Romanov, Orange-Nassau, and more)
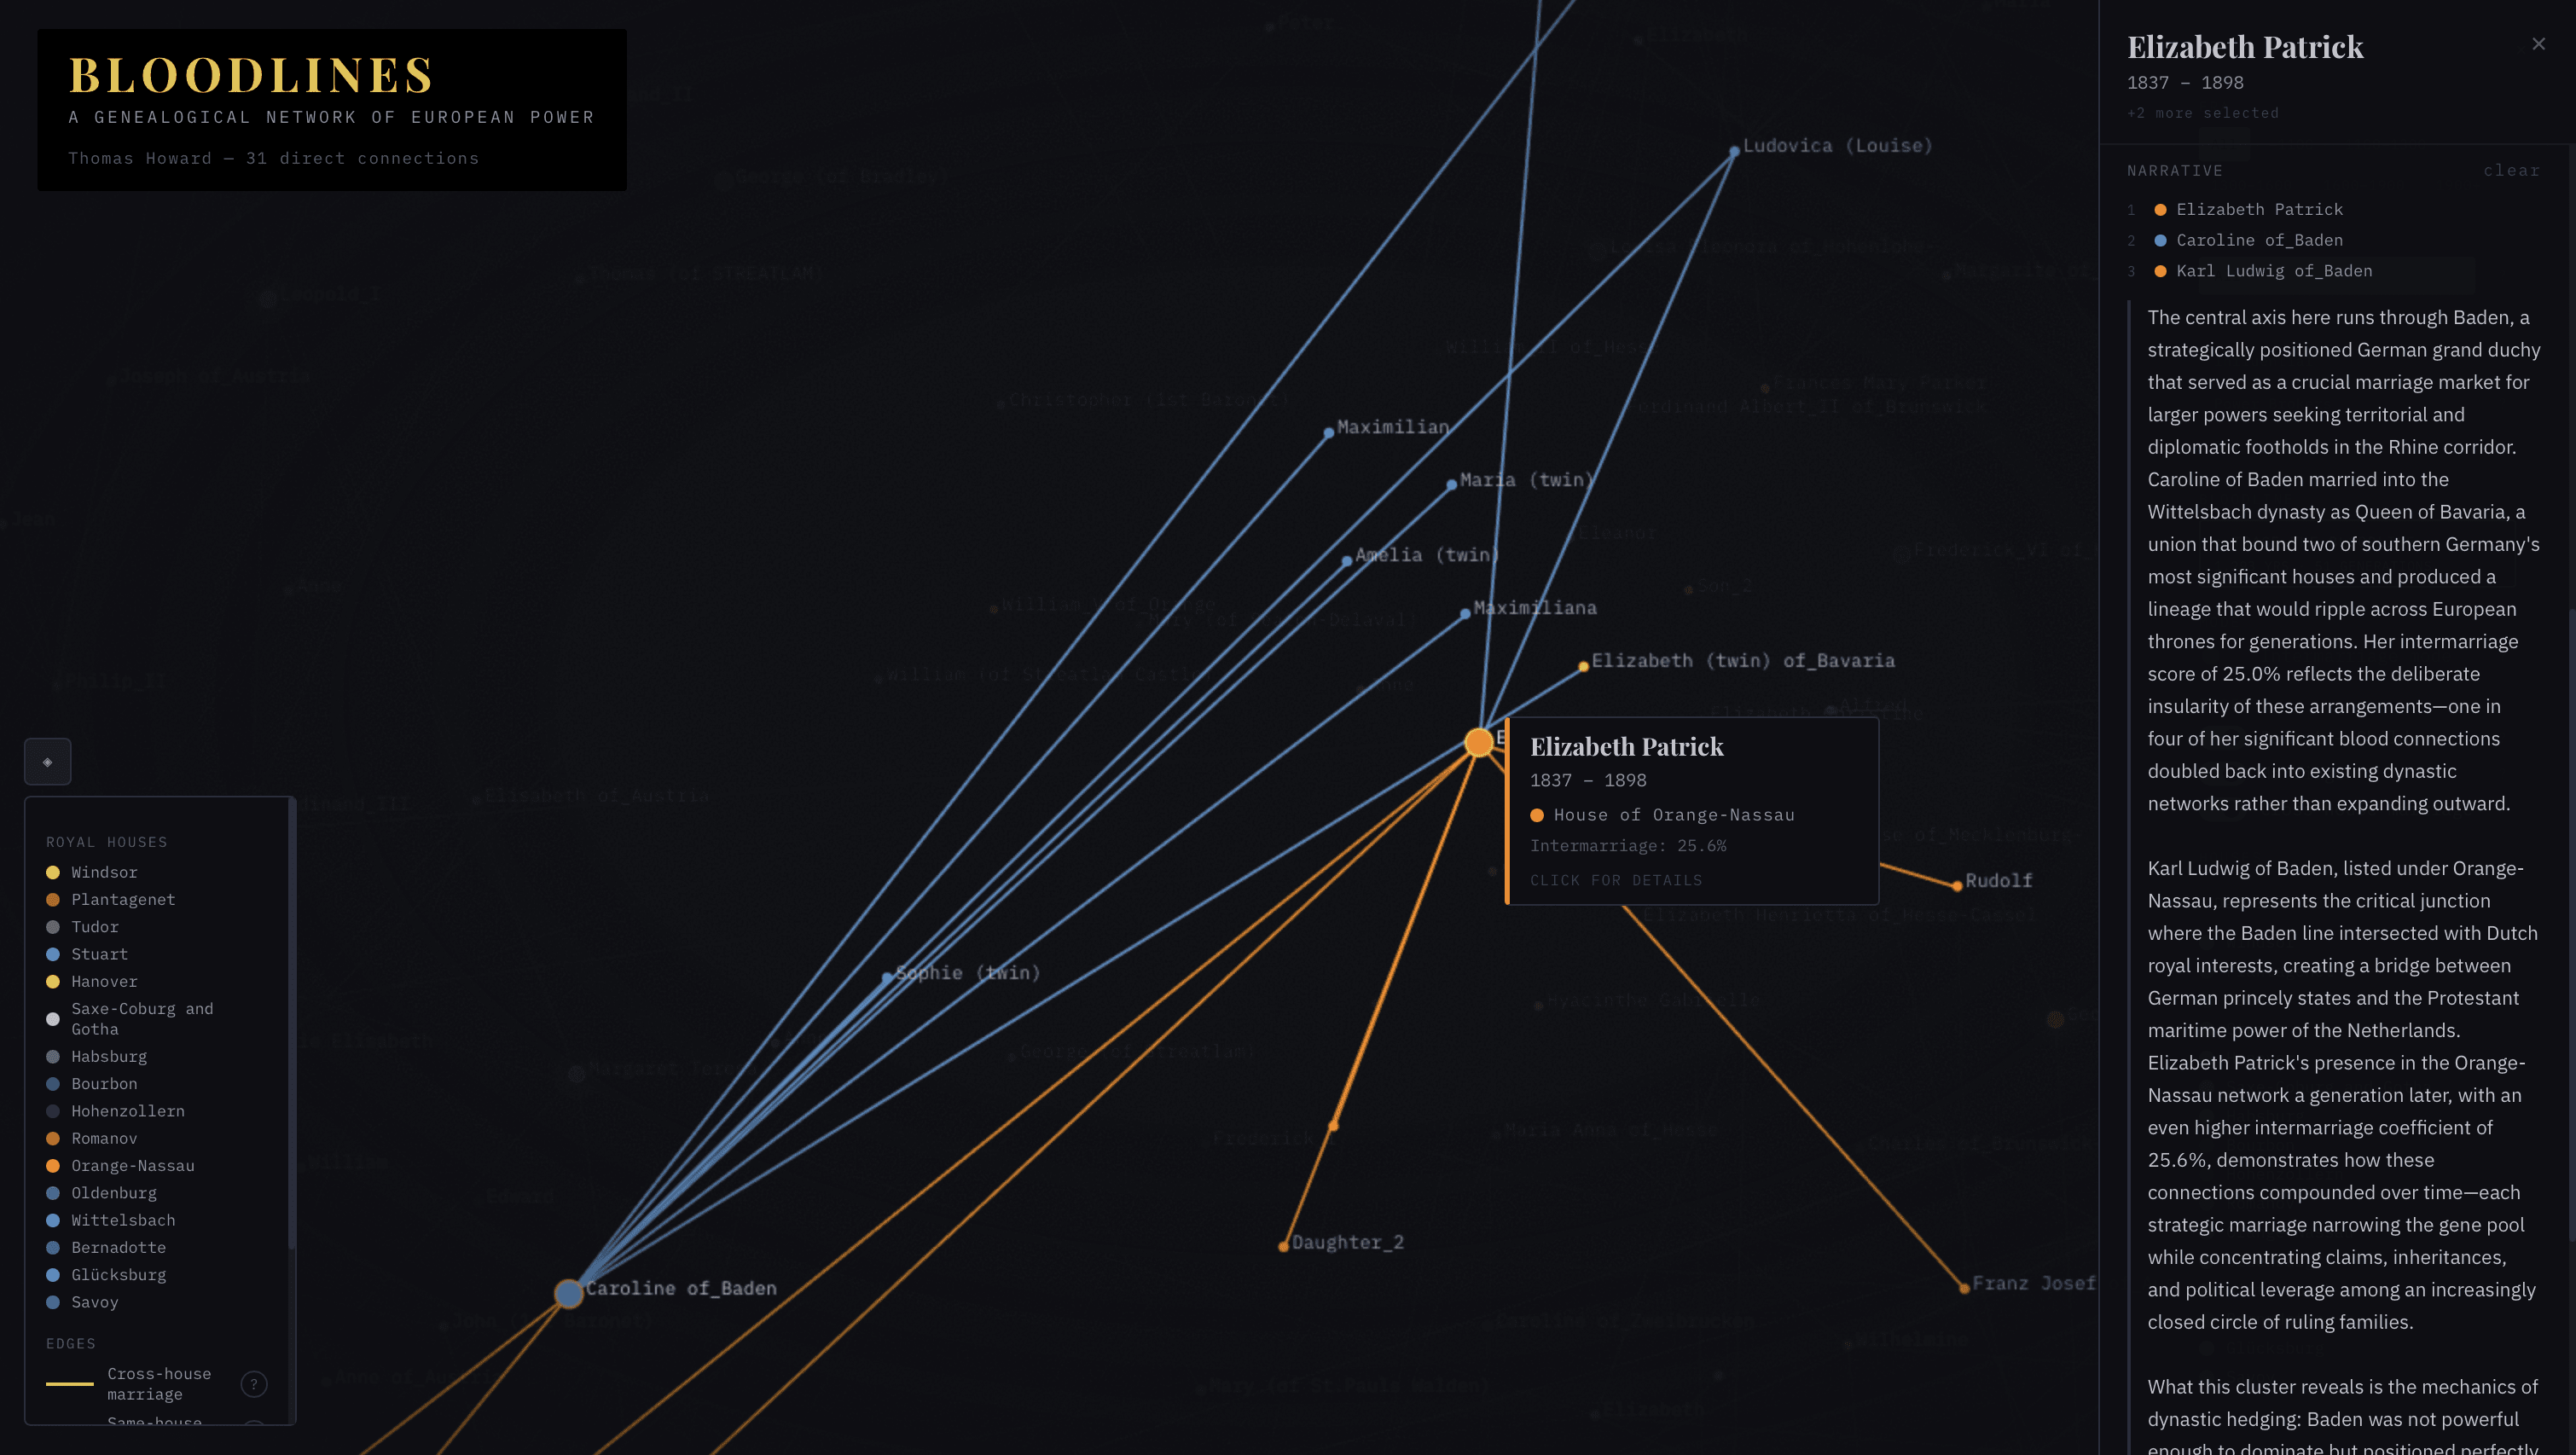
Intermarriage Mode toggle that dims blood connections and amplifies cross-house marriage edges — revealing the strategic alliance network as the dominant visual pattern
Semantic zoom with level-of-detail rendering: dots at continental scale, monarch labels at regional, full names at street level
Detail panels surfacing intermarriage scores, simultaneous throne counts, reign dates, and connection paths for every individual in the dataset
Century filtering and house isolation for focused exploration of specific periods or dynastic clusters
AI-generated narrative briefs powered by the Anthropic API — select any individual or trace a lineage of up to three connected figures and receive a contextual narrative synthesizing their political significance, strategic marriages, and role in the consolidation of power across houses. Each brief is generated on demand from the structured data, turning raw genealogical connections into readable intelligence.
What It Demonstrates
This project sits at the intersection of data engineering, interactive visualization, and strategic narrative — the core of what State Street Consulting does.
Data pipeline design: Parsing and merging legacy-format genealogical data (GEDCOM, a 1980s standard), enriching it with structured linked data via SPARQL, and computing derived analytical metrics — all in a repeatable, scriptable pipeline.
Performance-conscious visualization: Rendering thousands of interactive nodes at 30fps+ requires architectural decisions (Canvas over SVG, quadtree hit detection, viewport culling, Web Workers) that don't show up in the final product but make it possible.
Narrative through data encoding: The project's implicit argument — that European royal power was consolidated through deliberate intermarriage — is made entirely through visual density, color, and structure.
year
2026
timeframe
2 days
tools
React, Vite, D3.js, Tailwind CSS, Wikidata SPARQL, Vercel
category
Computational Social Science